95 Broadway Westfield, MA 01085
Estimated Value: $346,000 - $500,000
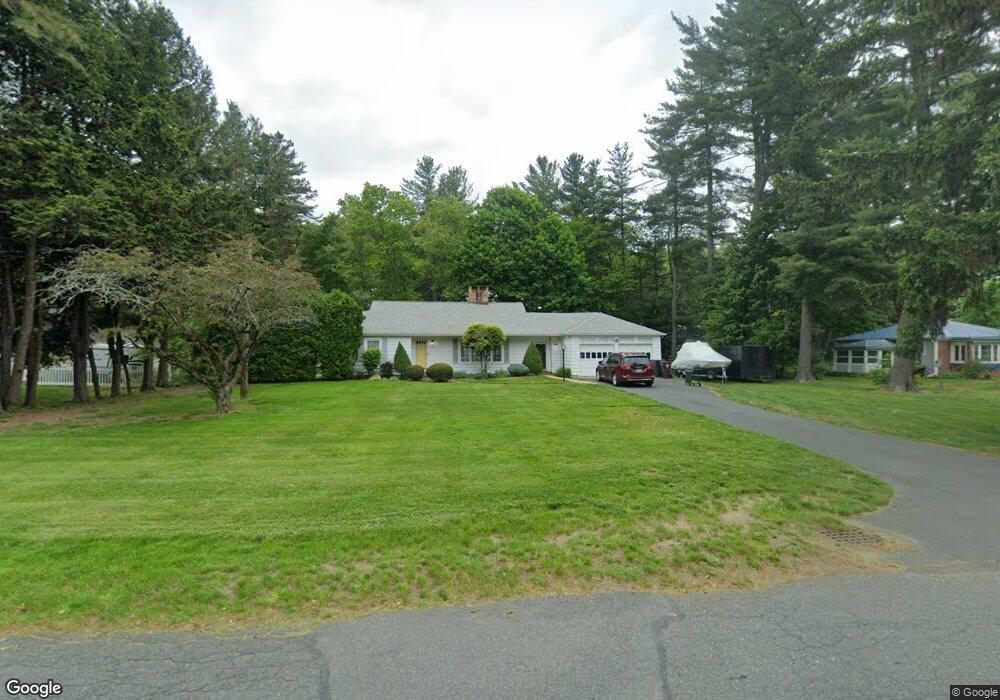
About This Home
This home is located at 95 Broadway, Westfield, MA 01085 and is currently estimated at $414,652, approximately $261 per square foot. 95 Broadway is a home located in Hampden County with nearby schools including Westfield High School and Saint Mary High School.
Ownership History
We collect this data history from publicly available records. To have your information removed, we recommend requesting removal directly through your county’s website.
Purchase Details
Home Financials for this Owner
Home Financials are based on the most recent Mortgage that was taken out on this home.Purchase Details
Home Values in the Area
Average Home Value in this Area
Purchase History
We collect this data history from publicly available records. To have your information removed, we recommend requesting removal directly through your county’s website.
| Date | Buyer | Sale Price | Title Company |
|---|---|---|---|
| $138,700 | -- | ||
| $154,900 | -- |
Mortgage History
We collect this data history from publicly available records. To have your information removed, we recommend requesting removal directly through your county’s website.
| Date | Status | Borrower | Loan Amount |
|---|---|---|---|
| Open | $60,000 | ||
| Open | $108,000 | ||
| Closed | $110,960 | ||
| Previous Owner | $250,000 |
Tax History
We collect this data history from publicly available records. To have your information removed, we recommend requesting removal directly through your county’s website.
| Year | Tax Paid | Tax Assessment Tax Assessment Total Assessment is a certain percentage of the fair market value that is determined by local assessors to be the total taxable value of land and additions on the property. | Land | Improvement |
|---|---|---|---|---|
| 2025 | $4,861 | $320,200 | $117,000 | $203,200 |
| 2024 | $4,943 | $309,500 | $106,300 | $203,200 |
| 2023 | $4,746 | $279,500 | $101,100 | $178,400 |
| 2022 | $4,567 | $247,000 | $90,200 | $156,800 |
| 2021 | $4,251 | $234,300 | $85,100 | $149,200 |
| 2020 | $4,291 | $222,900 | $85,100 | $137,800 |
| 2019 | $4,190 | $213,000 | $81,000 | $132,000 |
| 2018 | $4,124 | $213,000 | $81,000 | $132,000 |
| 2017 | $3,230 | $208,600 | $82,300 | $126,300 |
| 2016 | $4,055 | $208,600 | $82,300 | $126,300 |
| 2015 | $3,867 | $208,600 | $82,300 | $126,300 |
| 2014 | $2,892 | $208,600 | $82,300 | $126,300 |
Map
- 165 Western Ave
- 32 Spruce St
- 12 Woodland Rd
- 31 Lowell Ave
- 324 Russell Rd Unit 109
- 26 Wood Rd
- 180 Russell Rd
- 460 Russell Rd
- 472 Russell Rd
- 555 Russell Rd Unit J-65
- 32 Allen Ave
- 83 Court St
- 82 S Maple St Unit 38E
- 12 Franklin Ave
- 10 W School St
- 13 Hampden St
- 32 Margerie St
- 13 Green Ave
- 89 Kane Brothers Cir
- 17 Clark St
Ask me questions while you tour the home.