Estimated Value: $267,635 - $307,000
4
Beds
1
Bath
1,709
Sq Ft
$169/Sq Ft
Est. Value
About This Home
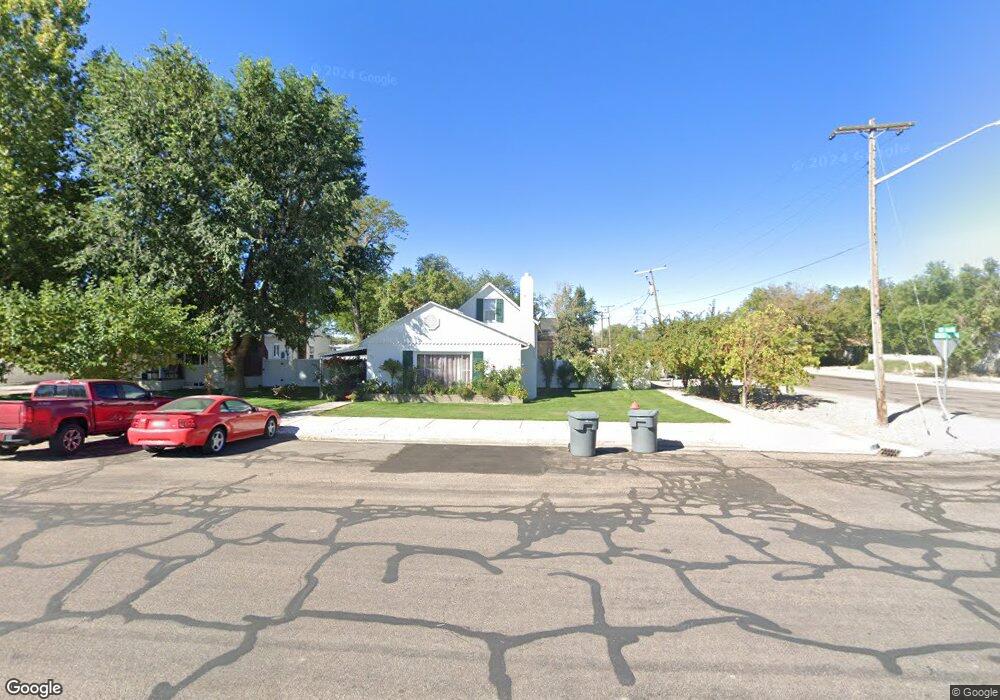
This home is located at 95 N 200 W, Delta, UT 84624 and is currently estimated at $288,909, approximately $169 per square foot. 95 N 200 W is a home located in Millard County with nearby schools including Cba Center and White River Academy.
Ownership History
Date
Name
Owned For
Owner Type
Purchase Details
Closed on
Jun 15, 2010
Sold by
Anderson Bruce and Anderson Sharla
Bought by
Peterson Mark K
Current Estimated Value
Home Financials for this Owner
Home Financials are based on the most recent Mortgage that was taken out on this home.
Original Mortgage
$90,000
Interest Rate
4.91%
Mortgage Type
VA
Purchase Details
Closed on
Jun 14, 2010
Sold by
Peterson Mark K
Bought by
Peterson Mark K and Peterson Sussan M
Home Financials for this Owner
Home Financials are based on the most recent Mortgage that was taken out on this home.
Original Mortgage
$90,000
Interest Rate
4.91%
Mortgage Type
VA
Create a Home Valuation Report for This Property
The Home Valuation Report is an in-depth analysis detailing your home's value as well as a comparison with similar homes in the area
Home Values in the Area
Average Home Value in this Area
Purchase History
| Date | Buyer | Sale Price | Title Company |
|---|---|---|---|
| Peterson Mark K | -- | -- | |
| Peterson Mark K | -- | -- |
Source: Public Records
Mortgage History
| Date | Status | Borrower | Loan Amount |
|---|---|---|---|
| Closed | Peterson Mark K | $90,000 | |
| Closed | Peterson Mark K | $90,000 |
Source: Public Records
Tax History
| Year | Tax Paid | Tax Assessment Tax Assessment Total Assessment is a certain percentage of the fair market value that is determined by local assessors to be the total taxable value of land and additions on the property. | Land | Improvement |
|---|---|---|---|---|
| 2025 | $3 | $147,408 | $15,710 | $131,698 |
| 2024 | $3 | $107,797 | $12,068 | $95,729 |
| 2023 | $2 | $107,797 | $12,068 | $95,729 |
| 2022 | $2 | $78,671 | $12,616 | $66,055 |
| 2021 | $2 | $63,463 | $9,540 | $53,923 |
| 2020 | $2 | $58,663 | $8,672 | $49,991 |
| 2019 | $2 | $55,732 | $8,030 | $47,702 |
| 2018 | $2 | $51,793 | $8,030 | $43,763 |
| 2017 | $2 | $51,559 | $7,796 | $43,763 |
| 2016 | -- | $51,559 | $7,796 | $43,763 |
| 2015 | -- | $51,559 | $7,796 | $43,763 |
| 2014 | -- | $35,661 | $7,796 | $27,865 |
| 2013 | -- | $35,661 | $7,796 | $27,865 |
Source: Public Records
Map
Nearby Homes
- 149 N 200 W
- 345 W 100 North Rd
- 163 W 100 S
- 341 W 100 S
- 325 N 100 W
- 435 W 100 S
- 320 N 450 W
- 334 N 450 W
- 294 S 300 W
- 254 S Center St
- 225 E Main St
- 87 S 300 East Rd
- 321 E 200 S
- 445 Topaz Blvd Unit 10
- 520 E 450 North Rd
- 648 Tamarix St
- 901 E 750 Rd N
- 1500 E 500 South Rd
- 2595 E 500 Rd S Unit 3
- 1805 E 500 South Rd
Your Personal Tour Guide
Ask me questions while you tour the home.