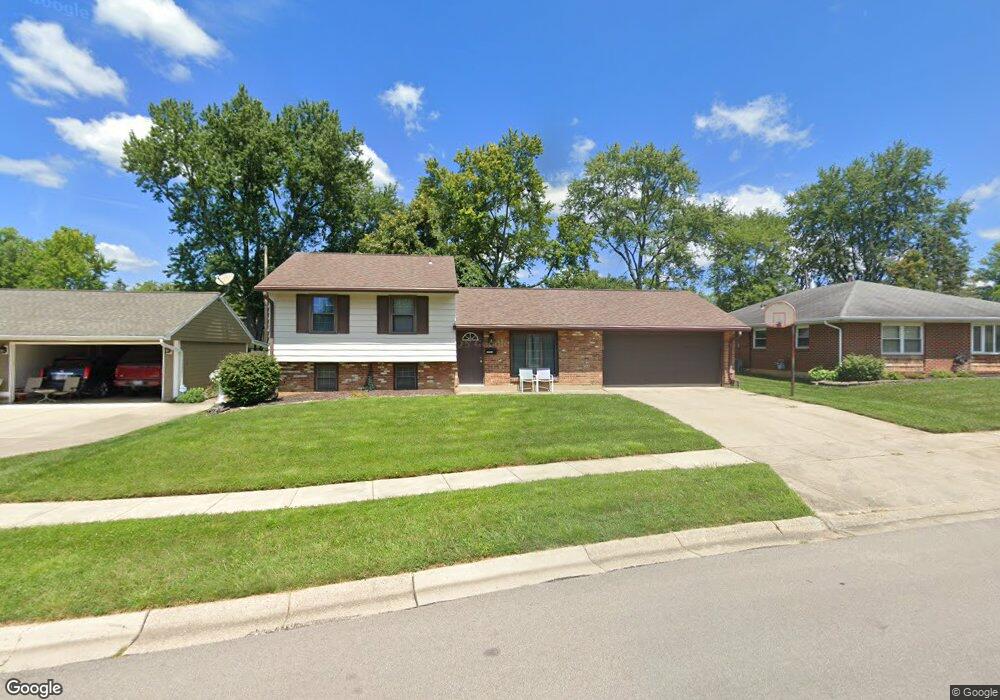
95 Paw Paw Dr Springboro, OH 45066
Estimated Value: $220,000 - $249,000
3
Beds
2
Baths
1,467
Sq Ft
$163/Sq Ft
Est. Value
About This Home
This home is located at 95 Paw Paw Dr, Springboro, OH 45066 and is currently estimated at $238,476, approximately $162 per square foot. 95 Paw Paw Dr is a home located in Warren County with nearby schools including Clearcreek Elementary School, Springboro Intermediate School, and Dennis Elementary School.
Ownership History
Date
Name
Owned For
Owner Type
Purchase Details
Closed on
Aug 26, 2011
Sold by
Dorko Erika A
Bought by
Dorko Robert J
Current Estimated Value
Home Financials for this Owner
Home Financials are based on the most recent Mortgage that was taken out on this home.
Original Mortgage
$119,193
Outstanding Balance
$81,265
Interest Rate
4.55%
Mortgage Type
New Conventional
Estimated Equity
$157,211
Purchase Details
Closed on
Dec 18, 2006
Sold by
Lefebvr Jason R and Lefebvre Jason R
Bought by
Dorko Robert J and Dorko Erika A
Home Financials for this Owner
Home Financials are based on the most recent Mortgage that was taken out on this home.
Original Mortgage
$120,000
Interest Rate
6.36%
Mortgage Type
Purchase Money Mortgage
Purchase Details
Closed on
Jan 4, 2000
Sold by
Crabtree Cathy A
Bought by
Lefebvr Jason R
Home Financials for this Owner
Home Financials are based on the most recent Mortgage that was taken out on this home.
Original Mortgage
$105,133
Interest Rate
7.69%
Mortgage Type
FHA
Purchase Details
Closed on
Dec 2, 1986
Sold by
Duncan Darrell L and Duncan Cath
Bought by
Duncan and Duncan Cathy A
Purchase Details
Closed on
Apr 3, 1978
Sold by
Olah Olah and Olah Edward C
Create a Home Valuation Report for This Property
The Home Valuation Report is an in-depth analysis detailing your home's value as well as a comparison with similar homes in the area
Home Values in the Area
Average Home Value in this Area
Purchase History
| Date | Buyer | Sale Price | Title Company |
|---|---|---|---|
| Dorko Robert J | -- | Attorney | |
| Dorko Robert J | $120,000 | Homesite Title | |
| Lefebvr Jason R | $106,000 | -- | |
| Duncan | -- | -- | |
| -- | $36,500 | -- |
Source: Public Records
Mortgage History
| Date | Status | Borrower | Loan Amount |
|---|---|---|---|
| Open | Dorko Robert J | $119,193 | |
| Closed | Dorko Robert J | $120,000 | |
| Closed | Lefebvr Jason R | $105,133 |
Source: Public Records
Tax History
| Year | Tax Paid | Tax Assessment Tax Assessment Total Assessment is a certain percentage of the fair market value that is determined by local assessors to be the total taxable value of land and additions on the property. | Land | Improvement |
|---|---|---|---|---|
| 2025 | $2,329 | $59,650 | $17,500 | $42,150 |
| 2024 | $2,329 | $59,650 | $17,500 | $42,150 |
| 2023 | $2,050 | $48,128 | $10,762 | $37,366 |
| 2022 | $2,055 | $48,129 | $10,763 | $37,366 |
| 2021 | $1,915 | $48,129 | $10,763 | $37,366 |
| 2020 | $1,783 | $39,130 | $8,750 | $30,380 |
| 2019 | $1,647 | $39,130 | $8,750 | $30,380 |
| 2018 | $1,612 | $39,130 | $8,750 | $30,380 |
| 2017 | $1,616 | $35,336 | $8,134 | $27,202 |
| 2016 | $1,686 | $35,336 | $8,134 | $27,202 |
| 2015 | $1,689 | $35,336 | $8,134 | $27,202 |
| 2014 | $1,732 | $34,310 | $7,900 | $26,410 |
| 2013 | $1,731 | $38,010 | $8,750 | $29,260 |
Source: Public Records
Map
Nearby Homes
- 490 W Market St
- 90 Libby Hollow St
- 40 Woods Rd
- 140 Dan Haven Place
- 15 Wadestone Ln
- 72 Pebble Brook Place
- 330 East St
- 45 Libby Hollow St
- 110 Elmwood Dr
- 660 S Main St
- 186 Farmstead Blvd
- 210 Foliage Ln
- 70 Eleanor Dr
- 50 Morris St
- 45 Morris St Unit 15
- 8 Glasgow St Unit 30
- 65 Morris St Unit 17
- 45 Morris St
- 8 Glasgow St
- 30 Morris St
Your Personal Tour Guide
Ask me questions while you tour the home.