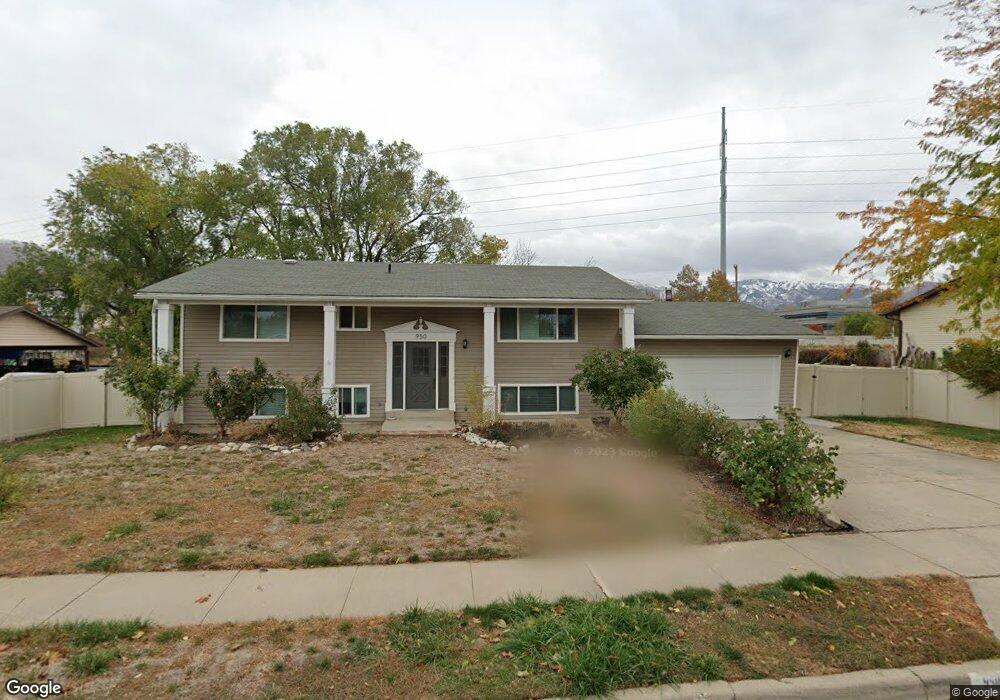
950 N 600 W West Bountiful, UT 84087
Estimated Value: $538,000 - $582,000
5
Beds
2
Baths
2,776
Sq Ft
$203/Sq Ft
Est. Value
About This Home
This home is located at 950 N 600 W, West Bountiful, UT 84087 and is currently estimated at $564,853, approximately $203 per square foot. 950 N 600 W is a home located in Davis County with nearby schools including West Bountiful Elementary School, Bountiful Junior High School, and Viewmont High School.
Ownership History
Date
Name
Owned For
Owner Type
Purchase Details
Closed on
Sep 30, 2020
Sold by
Atkinson Jennifer
Bought by
Harper Greg Erin and Harper Hailey
Current Estimated Value
Home Financials for this Owner
Home Financials are based on the most recent Mortgage that was taken out on this home.
Original Mortgage
$312,000
Outstanding Balance
$276,879
Interest Rate
2.9%
Mortgage Type
New Conventional
Estimated Equity
$287,974
Create a Home Valuation Report for This Property
The Home Valuation Report is an in-depth analysis detailing your home's value as well as a comparison with similar homes in the area
Home Values in the Area
Average Home Value in this Area
Purchase History
| Date | Buyer | Sale Price | Title Company |
|---|---|---|---|
| Harper Greg Erin | -- | Eagle Pointe Title |
Source: Public Records
Mortgage History
| Date | Status | Borrower | Loan Amount |
|---|---|---|---|
| Open | Harper Greg Erin | $312,000 |
Source: Public Records
Tax History
| Year | Tax Paid | Tax Assessment Tax Assessment Total Assessment is a certain percentage of the fair market value that is determined by local assessors to be the total taxable value of land and additions on the property. | Land | Improvement |
|---|---|---|---|---|
| 2025 | $3,265 | $282,150 | $125,427 | $156,723 |
| 2024 | $3,158 | $280,499 | $103,327 | $177,172 |
| 2023 | $3,046 | $273,350 | $106,781 | $166,568 |
| 2022 | $5,493 | $516,000 | $171,228 | $344,772 |
| 2021 | $2,880 | $404,000 | $129,014 | $274,986 |
| 2020 | $2,367 | $326,000 | $118,156 | $207,844 |
| 2019 | $2,282 | $311,000 | $118,000 | $193,000 |
| 2018 | $2,090 | $280,000 | $116,313 | $163,687 |
| 2016 | $1,790 | $130,460 | $37,965 | $92,495 |
| 2015 | $1,763 | $118,415 | $37,965 | $80,450 |
| 2014 | $1,739 | $120,428 | $38,053 | $82,375 |
| 2013 | -- | $106,060 | $32,335 | $73,725 |
Source: Public Records
Map
Nearby Homes
- 366 W 1000 N
- 1520 N 550 W
- 403 W 400 N Unit 1
- 401 W 400 N Unit 49
- 563 N 200 W
- 290 N 500 W Unit 108
- 290 N 500 W Unit 305
- 1130 N 200 W
- 499 N 200 W Unit 19
- 235 W 1400 N
- 1503 N 300 W
- 1260 N 200 W
- 332 N 300 W
- 449 W 200 N Unit 3
- 1625 Pages Place
- 320 N 200 W Unit 4
- 328 W Pages Ln
- 204 Lyman Ln
- 591 W 2050 N
- 17 E 400 N Unit 19B
Your Personal Tour Guide
Ask me questions while you tour the home.