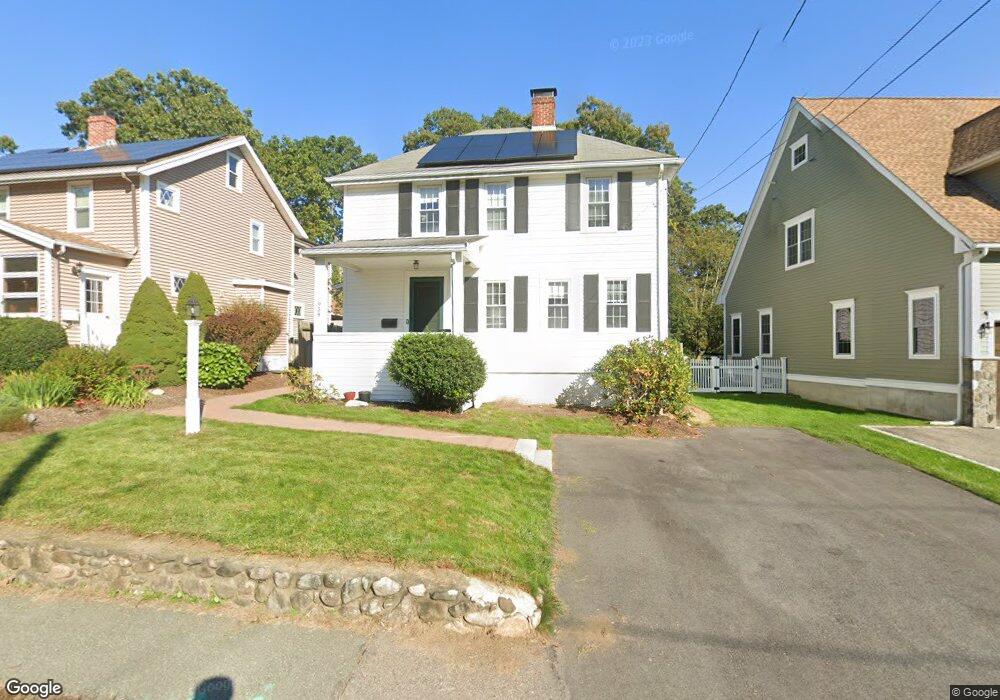
954 Webster St Needham, MA 02492
Estimated Value: $802,000 - $1,074,000
4
Beds
2
Baths
1,728
Sq Ft
$529/Sq Ft
Est. Value
About This Home
This home is located at 954 Webster St, Needham, MA 02492 and is currently estimated at $913,869, approximately $528 per square foot. 954 Webster St is a home located in Norfolk County with nearby schools including Newman Elementary School, High Rock Middle School, and Pollard Middle School.
Ownership History
Date
Name
Owned For
Owner Type
Purchase Details
Closed on
Mar 3, 2026
Sold by
Keeler Elizabeth
Bought by
Elizabeth Flynn Keeler Lt and Keeler
Current Estimated Value
Purchase Details
Closed on
Mar 20, 2014
Sold by
Millan Elizabeth and Millan Keith L
Bought by
Millan Elizabeth
Purchase Details
Closed on
Feb 2, 1999
Sold by
Griffin Matthew and Griffin Jill R
Bought by
Millan Elizabeth and Millan Keith L
Home Financials for this Owner
Home Financials are based on the most recent Mortgage that was taken out on this home.
Original Mortgage
$150,000
Interest Rate
6.67%
Mortgage Type
Purchase Money Mortgage
Purchase Details
Closed on
Mar 25, 1994
Sold by
Rivard Norbert and Rivard Roberta T
Bought by
Griffin Matthew and Griffin Jill R
Create a Home Valuation Report for This Property
The Home Valuation Report is an in-depth analysis detailing your home's value as well as a comparison with similar homes in the area
Home Values in the Area
Average Home Value in this Area
Purchase History
| Date | Buyer | Sale Price | Title Company |
|---|---|---|---|
| Elizabeth Flynn Keeler Lt | -- | -- | |
| Millan Elizabeth | -- | -- | |
| Millan Elizabeth | $248,000 | -- | |
| Griffin Matthew | $185,000 | -- |
Source: Public Records
Mortgage History
| Date | Status | Borrower | Loan Amount |
|---|---|---|---|
| Previous Owner | Griffin Matthew | $35,000 | |
| Previous Owner | Griffin Matthew | $150,000 | |
| Previous Owner | Griffin Matthew | $35,000 |
Source: Public Records
Tax History
| Year | Tax Paid | Tax Assessment Tax Assessment Total Assessment is a certain percentage of the fair market value that is determined by local assessors to be the total taxable value of land and additions on the property. | Land | Improvement |
|---|---|---|---|---|
| 2025 | $6,953 | $655,900 | $479,500 | $176,400 |
| 2024 | $7,344 | $586,600 | $402,800 | $183,800 |
| 2023 | $7,464 | $572,400 | $402,800 | $169,600 |
| 2022 | $7,162 | $535,700 | $373,000 | $162,700 |
| 2021 | $6,980 | $535,700 | $373,000 | $162,700 |
| 2020 | $6,663 | $533,500 | $373,700 | $159,800 |
| 2019 | $6,174 | $498,300 | $339,700 | $158,600 |
| 2018 | $5,920 | $498,300 | $339,700 | $158,600 |
| 2017 | $5,691 | $478,600 | $339,700 | $138,900 |
| 2016 | $5,546 | $480,600 | $339,700 | $140,900 |
| 2015 | $5,426 | $480,600 | $339,700 | $140,900 |
| 2014 | $5,026 | $431,800 | $295,400 | $136,400 |
Source: Public Records
Map
Nearby Homes
- 971 Webster St
- 1011 Webster St
- 1034 Webster St
- 60 Sutton Rd
- 150 Laurel Dr
- 18 Grant St Unit 2
- 34 Lincoln St Unit 34
- 133 Prince St
- 383 Manning St
- 126 Prince St
- 36 Otis St Unit 36
- 73 Maple St Unit 1
- 75 High Rock St
- 2 Denmark Ln Unit 2
- 569 Chestnut St
- 193 Garden St
- 674 Webster St
- 287 High Rock St
- 19 Oakland Ave Unit 19
- 31 Birds Hill Ave
- 962 Webster St
- 952 Webster St
- 944 Webster St
- 968 Webster St
- 955 Webster St
- 225 Dedham Ave
- 947 Webster St
- 938 Webster St
- 978 Webster St
- 219 Dedham Ave
- 229 Dedham Ave
- 945 Webster St
- 961 Webster St
- 239 Dedham Ave
- 967 Webster St
- 984 Webster St
- 213 Dedham Ave
- 935 Webster St
- 981 Webster St
- 981 Webster St Unit 981
Your Personal Tour Guide
Ask me questions while you tour the home.