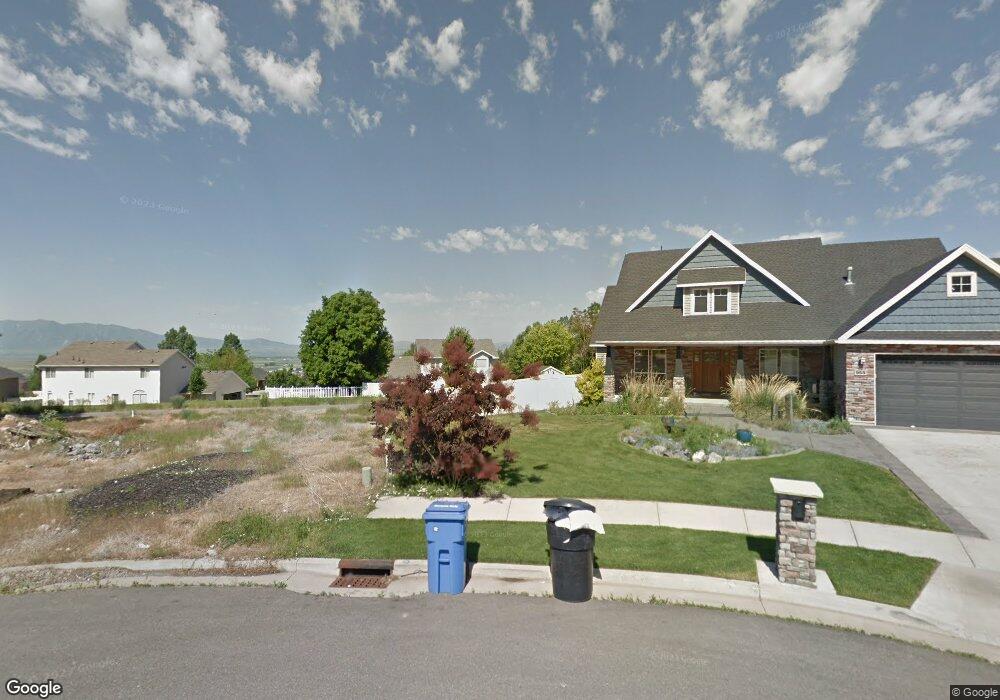
955 E 380 S Smithfield, UT 84335
Estimated Value: $658,000 - $845,000
6
Beds
5
Baths
4,508
Sq Ft
$173/Sq Ft
Est. Value
About This Home
This home is located at 955 E 380 S, Smithfield, UT 84335 and is currently estimated at $778,161, approximately $172 per square foot. 955 E 380 S is a home located in Cache County with nearby schools including Sunrise School, Cedar Ridge School, and North Cache Middle School.
Ownership History
Date
Name
Owned For
Owner Type
Purchase Details
Closed on
Feb 26, 2014
Sold by
Morgan Bryan E
Bought by
Morgan Bryan E and Morgan Michaella
Current Estimated Value
Home Financials for this Owner
Home Financials are based on the most recent Mortgage that was taken out on this home.
Original Mortgage
$353,780
Outstanding Balance
$266,982
Interest Rate
4.38%
Mortgage Type
New Conventional
Estimated Equity
$511,179
Purchase Details
Closed on
May 23, 2011
Sold by
Latimer Zachary V and Farrell Brown J
Bought by
Brown J Farrell and Brown Judy
Purchase Details
Closed on
May 31, 2006
Sold by
Nixon E J
Bought by
Goodfellow Kelly
Home Financials for this Owner
Home Financials are based on the most recent Mortgage that was taken out on this home.
Original Mortgage
$61,400
Interest Rate
10%
Mortgage Type
Seller Take Back
Create a Home Valuation Report for This Property
The Home Valuation Report is an in-depth analysis detailing your home's value as well as a comparison with similar homes in the area
Home Values in the Area
Average Home Value in this Area
Purchase History
| Date | Buyer | Sale Price | Title Company |
|---|---|---|---|
| Morgan Bryan E | -- | Cache Title Logan | |
| Morgan Bryan E | -- | Heritage Title | |
| Brown J Farrell | -- | Hickman Land Title Co | |
| Goodfellow Kelly | -- | Northern Title Company |
Source: Public Records
Mortgage History
| Date | Status | Borrower | Loan Amount |
|---|---|---|---|
| Open | Morgan Bryan E | $353,780 | |
| Previous Owner | Goodfellow Kelly | $61,400 |
Source: Public Records
Tax History
| Year | Tax Paid | Tax Assessment Tax Assessment Total Assessment is a certain percentage of the fair market value that is determined by local assessors to be the total taxable value of land and additions on the property. | Land | Improvement |
|---|---|---|---|---|
| 2025 | $3,348 | $448,215 | $0 | $0 |
| 2024 | $3,302 | $414,650 | $0 | $0 |
| 2023 | $3,474 | $412,610 | $0 | $0 |
| 2022 | $3,531 | $412,610 | $0 | $0 |
| 2021 | $2,966 | $529,401 | $80,000 | $449,401 |
| 2020 | $2,827 | $470,784 | $80,000 | $390,784 |
| 2019 | $2,833 | $449,734 | $58,950 | $390,784 |
| 2018 | $2,657 | $407,865 | $58,950 | $348,915 |
| 2017 | $2,566 | $215,190 | $0 | $0 |
| 2016 | $2,611 | $189,905 | $0 | $0 |
| 2015 | $2,313 | $189,905 | $0 | $0 |
| 2014 | $2,268 | $189,905 | $0 | $0 |
| 2013 | $2,111 | $189,905 | $0 | $0 |
Source: Public Records
Map
Nearby Homes
- 127 S 830 E Unit 304
- 434 S Cardon Ridge Dr
- 1092 E 300 S
- 413 S 1150 E Unit 1101
- 12 S 1150 E Unit 8
- 577 S 1140 E Unit 1202
- 641 S 1080 E Unit 44
- 670 S 1080 E Unit 37
- 628 S 1080 E
- 111 S 1250 E
- 2 S 1200 E Unit 15
- 722 S 1040 E Unit 21
- 738 S 1150 E Unit 9
- 776 S 1150 E
- 13 N 1150 E
- 442 S 455 E
- 396 S 455 E
- 139 Fairway Dr
- 125 Fairway Dr
- 641 S 380 E
Your Personal Tour Guide
Ask me questions while you tour the home.