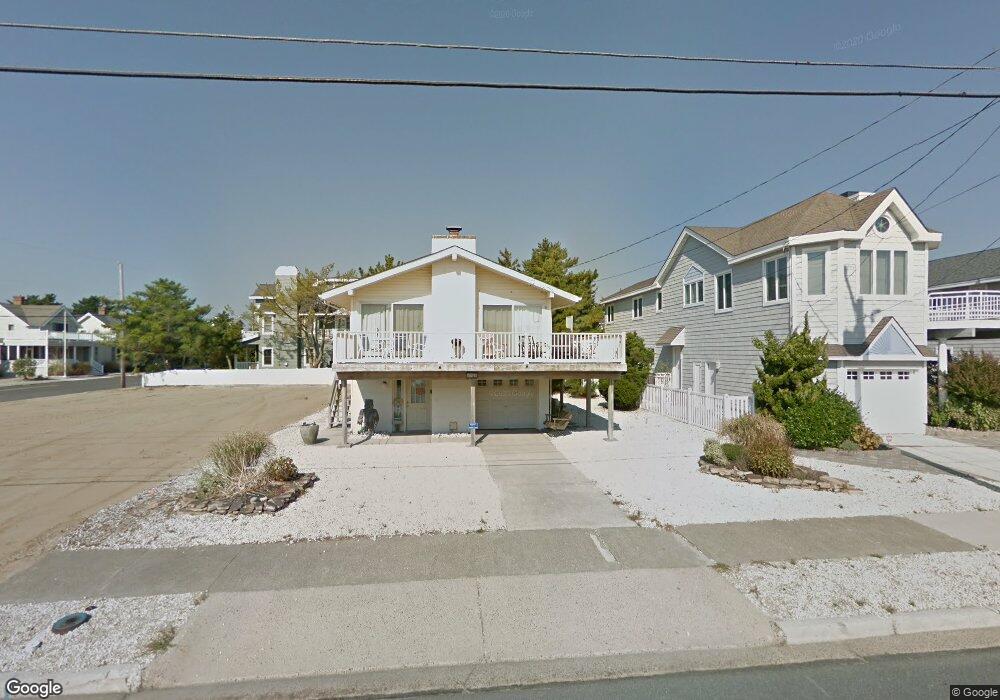
958 Avalon Ave Avalon, NJ 08202
Estimated Value: $3,407,000 - $5,576,418
Studio
--
Bath
1,656
Sq Ft
$2,752/Sq Ft
Est. Value
About This Home
This home is located at 958 Avalon Ave, Avalon, NJ 08202 and is currently estimated at $4,557,605, approximately $2,752 per square foot. 958 Avalon Ave is a home located in Cape May County with nearby schools including Avalon Elementary School.
Ownership History
Date
Name
Owned For
Owner Type
Purchase Details
Closed on
Nov 8, 2012
Sold by
Funke Richard E and Funke Sandra A
Bought by
Davies Edward C and Davies Carla B
Current Estimated Value
Purchase Details
Closed on
Dec 11, 1991
Sold by
Realty Exchange Services Inc
Bought by
Funke Richard E and Funke Sandra A
Purchase Details
Closed on
Sep 21, 1991
Sold by
Realty Exchange Services Inc
Bought by
Funke Richard E and Funke Sandra A
Create a Home Valuation Report for This Property
The Home Valuation Report is an in-depth analysis detailing your home's value as well as a comparison with similar homes in the area
Home Values in the Area
Average Home Value in this Area
Purchase History
We collect this data history from publicly available records. To have your information removed, we recommend requesting removal directly through your county’s website.
| Date | Buyer | Sale Price | Title Company |
|---|---|---|---|
| Davies Edward C | $900,000 | Surety Title Company Llc | |
| Funke Richard E | $275,000 | -- | |
| Funke Richard E | $275,000 | -- | |
| Realty Exchange Services Inc | -- | -- |
Source: Public Records
Tax History
| Year | Tax Paid | Tax Assessment Tax Assessment Total Assessment is a certain percentage of the fair market value that is determined by local assessors to be the total taxable value of land and additions on the property. | Land | Improvement |
|---|---|---|---|---|
| 2025 | $18,535 | $3,018,800 | $1,300,000 | $1,718,800 |
| 2024 | $18,535 | $3,018,800 | $1,300,000 | $1,718,800 |
| 2023 | $18,168 | $2,983,300 | $1,300,000 | $1,683,300 |
| 2022 | $16,945 | $2,983,300 | $1,300,000 | $1,683,300 |
| 2021 | $4,988 | $3,018,800 | $1,300,000 | $1,718,800 |
| 2020 | $6,838 | $1,300,000 | $1,300,000 | $0 |
| 2019 | $6,690 | $1,311,800 | $1,300,000 | $11,800 |
| 2018 | $6,402 | $1,311,800 | $1,300,000 | $11,800 |
| 2017 | $6,003 | $1,079,700 | $1,000,000 | $79,700 |
| 2016 | $5,938 | $1,079,700 | $1,000,000 | $79,700 |
| 2015 | $5,841 | $1,079,700 | $1,000,000 | $79,700 |
| 2014 | $5,776 | $1,079,700 | $1,000,000 | $79,700 |
Source: Public Records
Map
Nearby Homes
Your Personal Tour Guide
Ask me questions while you tour the home.