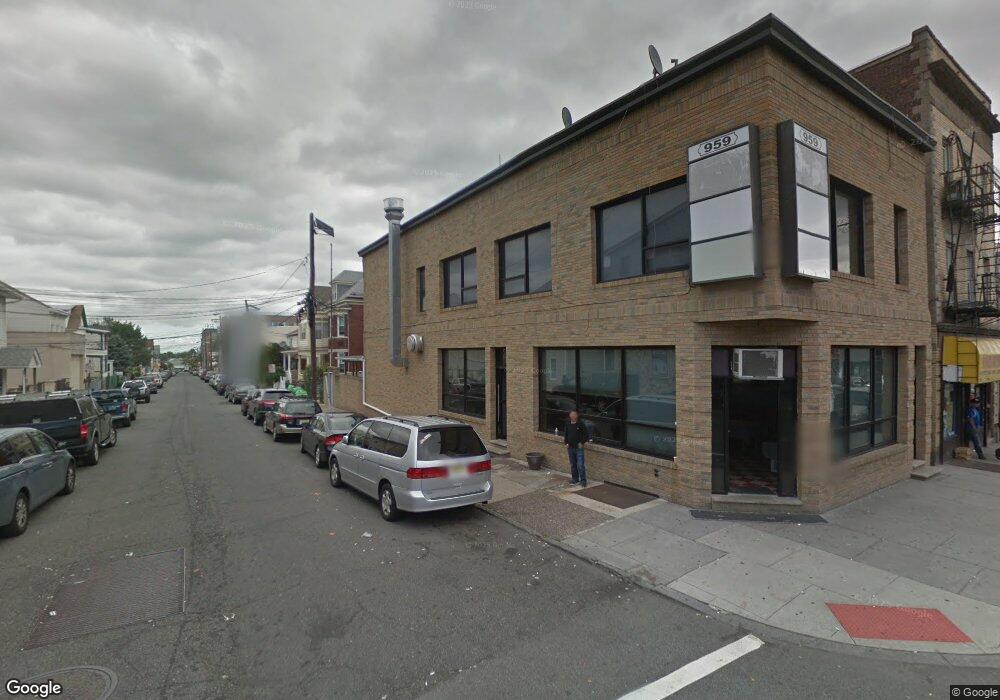
959 Main St Paterson, NJ 07503
South Paterson NeighborhoodEstimated Value: $643,000 - $1,196,338
About This Home
This home is located at 959 Main St, Paterson, NJ 07503 and is currently estimated at $919,669, approximately $281 per square foot. 959 Main St is a home with nearby schools including Dale Avenue Elementary School, Edward W. Kilpatrick School of Discovery, and Paterson Public School No. 3.
Ownership History
We collect this data history from publicly available records. To have your information removed, we recommend requesting removal directly through your county’s website.
Purchase Details
Home Financials for this Owner
Home Financials are based on the most recent Mortgage that was taken out on this home.Purchase Details
Home Financials for this Owner
Home Financials are based on the most recent Mortgage that was taken out on this home.Home Values in the Area
Average Home Value in this Area
Purchase History
We collect this data history from publicly available records. To have your information removed, we recommend requesting removal directly through your county’s website.
| Date | Buyer | Sale Price | Title Company |
|---|---|---|---|
| $650,000 | -- | ||
| $150,000 | -- |
Mortgage History
We collect this data history from publicly available records. To have your information removed, we recommend requesting removal directly through your county’s website.
| Date | Status | Borrower | Loan Amount |
|---|---|---|---|
| Open | $300,000 | ||
| Previous Owner | $105,000 |
Tax History
We collect this data history from publicly available records. To have your information removed, we recommend requesting removal directly through your county’s website.
| Year | Tax Paid | Tax Assessment Tax Assessment Total Assessment is a certain percentage of the fair market value that is determined by local assessors to be the total taxable value of land and additions on the property. | Land | Improvement |
|---|---|---|---|---|
| 2025 | $30,764 | $323,800 | $49,400 | $274,400 |
| 2024 | $29,604 | $603,800 | $79,400 | $524,400 |
| 2022 | $28,028 | $603,800 | $79,400 | $524,400 |
| 2021 | $27,026 | $603,800 | $79,400 | $524,400 |
| 2020 | $25,209 | $603,800 | $79,400 | $524,400 |
| 2019 | $24,961 | $603,800 | $79,400 | $524,400 |
| 2018 | $24,875 | $575,000 | $79,400 | $495,600 |
| 2017 | $23,920 | $575,000 | $79,400 | $495,600 |
| 2016 | $27,279 | $628,700 | $79,400 | $549,300 |
| 2015 | $25,827 | $628,700 | $79,400 | $549,300 |
| 2014 | $16,623 | $573,200 | $132,000 | $441,200 |
Map
- 5 Montclair Ave
- 126 Gould Ave
- 339 Paxton St
- 311 Paxton St
- 29 Robert St
- 354 Dakota St
- 45 Dey St
- 82 Montclair Ave Unit 88
- 88 Montclair Ave Unit 90
- 54 Bloomfield Ave Unit 56
- 14-16 Dey St
- 14 Dey St Unit 16
- 28 Buffalo Ave Unit 30
- 268 Atlantic St
- 23 Prospect St
- 235 Dakota St
- 235 Dakota St Unit 1
- 235 Dakota St Unit 10
- 28 Butler St
- 80 Newark Ave
Ask me questions while you tour the home.