96 June St Northbridge, MA 01534
Estimated Value: $343,000 - $1,008,000
About This Home
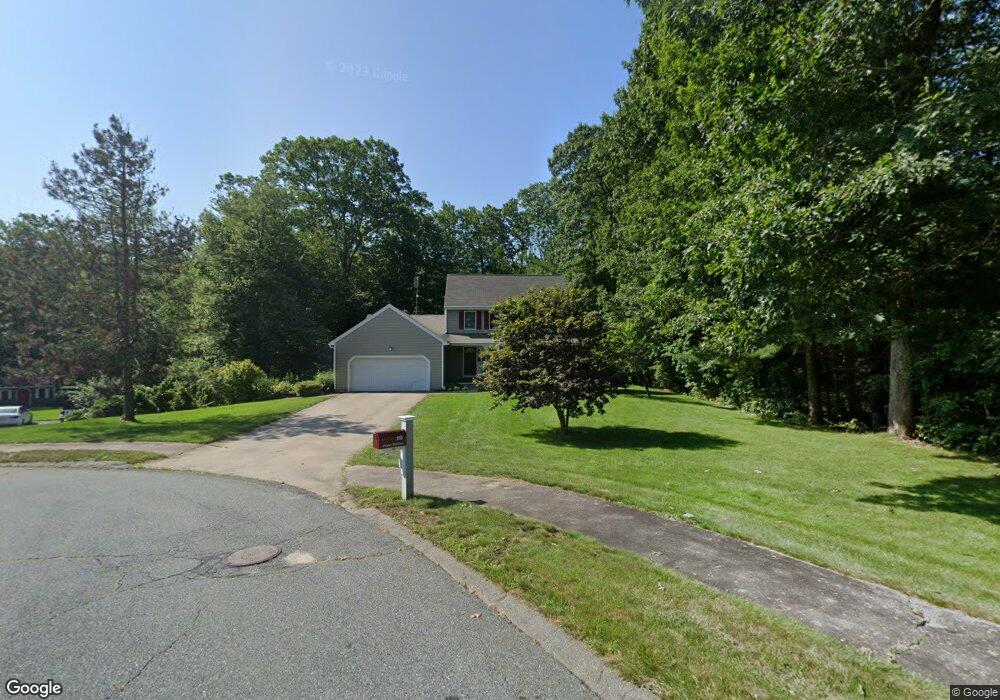
This home is located at 96 June St, Northbridge, MA 01534 and is currently estimated at $646,549, approximately $307 per square foot. 96 June St is a home located in Worcester County with nearby schools including Northbridge Elementary School, Northbridge Middle School, and Northbridge High School.
Ownership History
We collect this data history from publicly available records. To have your information removed, we recommend requesting removal directly through your county’s website.
Purchase Details
Purchase Details
Home Values in the Area
Average Home Value in this Area
Purchase History
We collect this data history from publicly available records. To have your information removed, we recommend requesting removal directly through your county’s website.
| Date | Buyer | Sale Price | Title Company |
|---|---|---|---|
| $258,000 | -- | ||
| $232,436 | -- | ||
| $232,436 | -- |
Mortgage History
We collect this data history from publicly available records. To have your information removed, we recommend requesting removal directly through your county’s website.
| Date | Status | Borrower | Loan Amount |
|---|---|---|---|
| Previous Owner | $60,000 | ||
| Previous Owner | $60,000 |
Tax History
We collect this data history from publicly available records. To have your information removed, we recommend requesting removal directly through your county’s website.
| Year | Tax Paid | Tax Assessment Tax Assessment Total Assessment is a certain percentage of the fair market value that is determined by local assessors to be the total taxable value of land and additions on the property. | Land | Improvement |
|---|---|---|---|---|
| 2025 | $6,633 | $562,600 | $190,000 | $372,600 |
| 2024 | $6,434 | $532,200 | $190,000 | $342,200 |
| 2023 | $6,234 | $481,000 | $174,300 | $306,700 |
| 2022 | $5,779 | $419,700 | $134,700 | $285,000 |
| 2021 | $5,682 | $392,100 | $128,500 | $263,600 |
| 2020 | $5,265 | $380,400 | $128,500 | $251,900 |
| 2019 | $4,746 | $365,900 | $128,500 | $237,400 |
| 2018 | $2,351 | $351,000 | $122,300 | $228,700 |
| 2017 | $4,514 | $333,600 | $122,300 | $211,300 |
| 2016 | $4,425 | $321,800 | $111,200 | $210,600 |
| 2015 | $4,306 | $321,800 | $111,200 | $210,600 |
| 2014 | $4,267 | $321,800 | $111,200 | $210,600 |
Map
- 111 Lea Ave
- 172 Sutton St
- 1076 Hill St
- 206 Washington St
- 100 Delmar Dr
- 320 Lincoln Cir
- 2428-2430 Providence Rd
- 2294 Providence Rd
- 2248 Providence Rd
- 2246 Providence Rd
- 90 Windstone Dr
- 2120 Providence Rd
- 9 Central Ave Unit 11
- 4 Central Ave
- 399 Providence Rd Unit A
- 110 Chipper Hill Rd
- 15 Legion Way
- 0 S Main St
- 4 Brookmeadow Ln
- 1617 Providence Rd
Ask me questions while you tour the home.