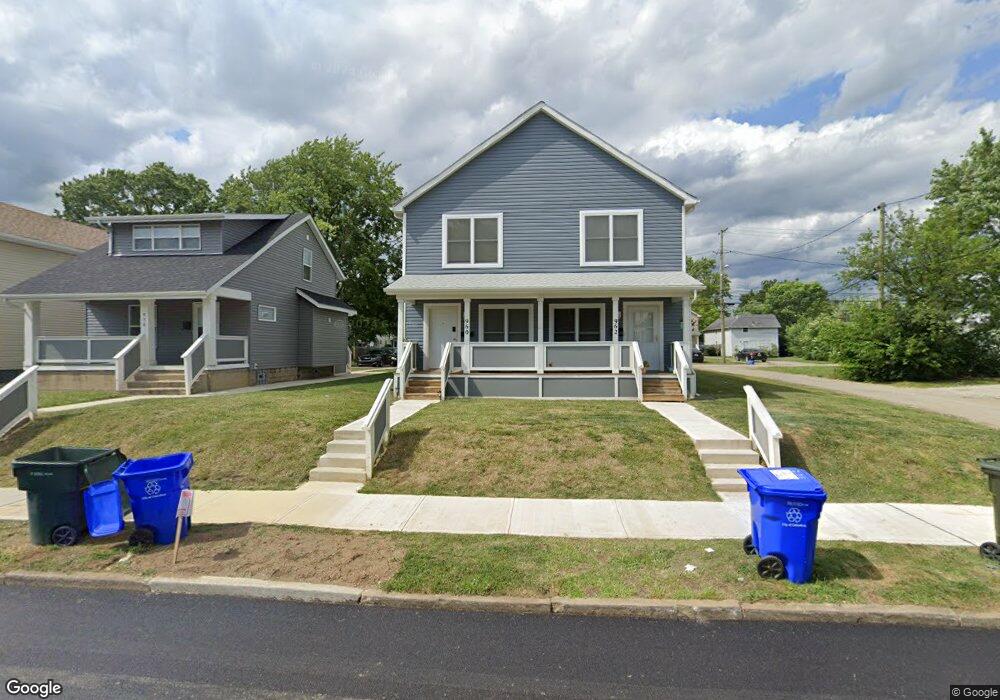
960 Chittenden Ave Columbus, OH 43211
South Linden NeighborhoodEstimated Value: $155,000 - $323,273
4
Beds
2
Baths
2,760
Sq Ft
$90/Sq Ft
Est. Value
About This Home
This home is located at 960 Chittenden Ave, Columbus, OH 43211 and is currently estimated at $249,568, approximately $90 per square foot. 960 Chittenden Ave is a home located in Franklin County with nearby schools including Windsor Stem Acadmey, Linden-Mckinley Stem School On Arcadia, and North Columbus Preparatory Academy.
Ownership History
Date
Name
Owned For
Owner Type
Purchase Details
Closed on
Mar 23, 2021
Sold by
Central Ohio Community Improvement Corp
Bought by
Healty Linden Homes
Current Estimated Value
Purchase Details
Closed on
Jan 14, 2021
Sold by
City Of Columbus
Bought by
Central Ohio Community Improvement Corp
Purchase Details
Closed on
Aug 22, 2014
Sold by
Municipal Tax Property Llc
Bought by
City Of Columbus
Purchase Details
Closed on
Feb 5, 2014
Sold by
Chambliss Nicole
Bought by
Municipal Tax Investment Llc
Purchase Details
Closed on
Aug 5, 2004
Sold by
Chambliss Teresa J
Bought by
Chambliss Nicole
Home Financials for this Owner
Home Financials are based on the most recent Mortgage that was taken out on this home.
Original Mortgage
$55,250
Interest Rate
6.35%
Mortgage Type
Purchase Money Mortgage
Purchase Details
Closed on
Mar 25, 1988
Bought by
Smith Clarence
Create a Home Valuation Report for This Property
The Home Valuation Report is an in-depth analysis detailing your home's value as well as a comparison with similar homes in the area
Home Values in the Area
Average Home Value in this Area
Purchase History
| Date | Buyer | Sale Price | Title Company |
|---|---|---|---|
| Healty Linden Homes | -- | None Available | |
| Central Ohio Community Improvement Corp | -- | None Available | |
| City Of Columbus | -- | Title Co Lt | |
| Municipal Tax Investment Llc | $10,056 | None Available | |
| Chambliss Nicole | $65,000 | Trident Title Agency | |
| Smith Clarence | $12,000 | -- |
Source: Public Records
Mortgage History
| Date | Status | Borrower | Loan Amount |
|---|---|---|---|
| Previous Owner | Chambliss Nicole | $55,250 |
Source: Public Records
Tax History
| Year | Tax Paid | Tax Assessment Tax Assessment Total Assessment is a certain percentage of the fair market value that is determined by local assessors to be the total taxable value of land and additions on the property. | Land | Improvement |
|---|---|---|---|---|
| 2025 | $294 | $105,320 | $6,410 | $98,910 |
| 2024 | $294 | $105,320 | $6,410 | $98,910 |
| 2023 | $290 | $105,320 | $6,410 | $98,910 |
| 2022 | $151 | $2,840 | $2,840 | $0 |
| 2021 | $0 | $2,840 | $2,840 | $0 |
Source: Public Records
Map
Nearby Homes
- 957 E 12th Ave
- 928 Chittenden Ave
- 957 E 13th Ave
- 915 E 13th Ave
- 1445-1447 Jefferson Ave
- 1027 E 14th Ave
- 1111 Windsor Ave
- 1121 Windsor Ave
- 990 E 16th Ave
- 1070 E 16th Ave
- 1705 Lexington Ave
- 1111-1113 E 16th Ave
- 957 E 17th Ave
- 923 Camden Ave
- 927 Camden Ave
- 1129 E 17th Ave
- 1673 Cleveland Ave
- 1037 E 18th Ave
- 1249-1251 E 15th Ave
- 927 E 18th Ave
- 956 Chittenden Ave
- 952 Chittenden Ave
- 948 Chittenden Ave
- 1463 Cleveland Ave
- 1467 Cleveland Ave
- 1469 Cleveland Ave
- 944 Chittenden Ave
- 969 E 12th Ave
- 973 E 12th Ave
- 979 E 12th Ave
- 940 Chittenden Ave
- 983 E 12th Ave
- 1449 Cleveland Ave
- 953 E 12th Ave
- 1473 Cleveland Ave
- 1473 Cleveland Ave
- 936 Chittenden Ave
- 1443 Cleveland Ave
- 941 Chittenden Ave
- 947 E 12th Ave
Your Personal Tour Guide
Ask me questions while you tour the home.