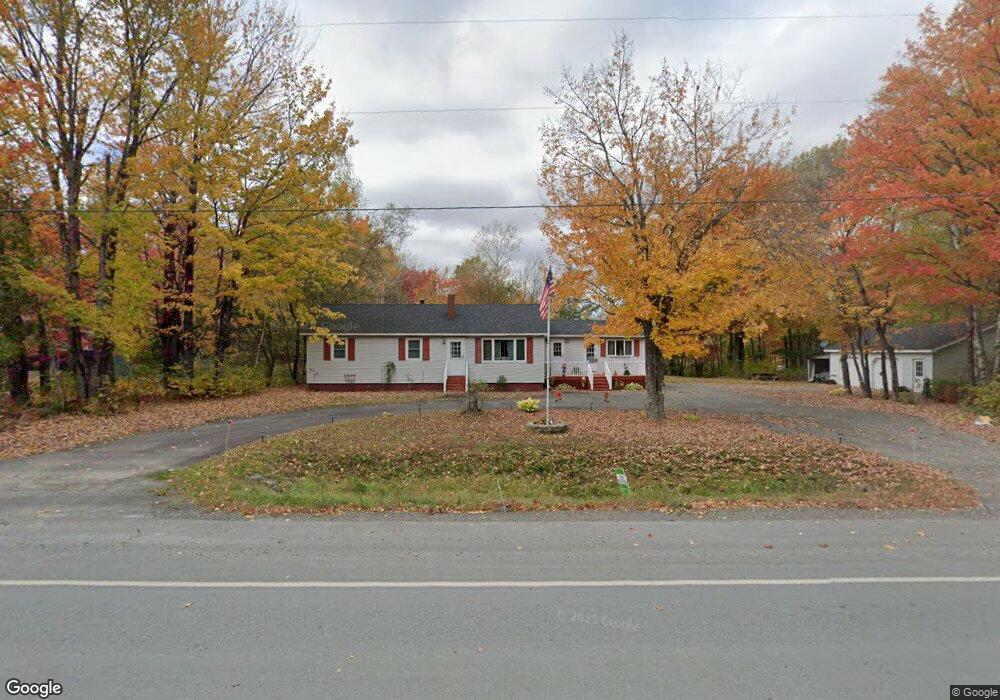
960 Main Rd Enfield, ME 04493
Estimated Value: $213,000 - $237,394
3
Beds
2
Baths
1,512
Sq Ft
$150/Sq Ft
Est. Value
About This Home
This home is located at 960 Main Rd, Enfield, ME 04493 and is currently estimated at $227,349, approximately $150 per square foot. 960 Main Rd is a home located in Penobscot County with nearby schools including Enfield Station Elementary School, Hichborn Middle School, and Penobscot Valley High School.
Ownership History
Date
Name
Owned For
Owner Type
Purchase Details
Closed on
Mar 30, 2007
Sold by
Cloukey Timothy K and Clukey Timothy
Bought by
Workman Melissa J
Current Estimated Value
Home Financials for this Owner
Home Financials are based on the most recent Mortgage that was taken out on this home.
Original Mortgage
$127,000
Outstanding Balance
$76,784
Interest Rate
6.33%
Mortgage Type
Purchase Money Mortgage
Estimated Equity
$150,565
Create a Home Valuation Report for This Property
The Home Valuation Report is an in-depth analysis detailing your home's value as well as a comparison with similar homes in the area
Purchase History
| Date | Buyer | Sale Price | Title Company |
|---|---|---|---|
| Workman Melissa J | -- | -- |
Source: Public Records
Mortgage History
| Date | Status | Borrower | Loan Amount |
|---|---|---|---|
| Open | Workman Melissa J | $127,000 |
Source: Public Records
Tax History
| Year | Tax Paid | Tax Assessment Tax Assessment Total Assessment is a certain percentage of the fair market value that is determined by local assessors to be the total taxable value of land and additions on the property. | Land | Improvement |
|---|---|---|---|---|
| 2025 | $3,037 | $208,700 | $32,200 | $176,500 |
| 2024 | $2,577 | $208,700 | $32,200 | $176,500 |
| 2023 | $2,139 | $130,100 | $22,500 | $107,600 |
| 2022 | $1,930 | $117,400 | $19,600 | $97,800 |
| 2021 | $2,019 | $110,100 | $17,800 | $92,300 |
| 2020 | $2,087 | $110,100 | $17,800 | $92,300 |
| 2019 | $2,087 | $110,100 | $17,800 | $92,300 |
| 2018 | $2,087 | $110,100 | $17,800 | $92,300 |
| 2017 | $2,037 | $110,100 | $17,800 | $92,300 |
| 2016 | $1,943 | $110,100 | $17,800 | $92,300 |
| 2015 | $1,773 | $110,100 | $17,800 | $92,300 |
| 2014 | $1,552 | $96,400 | $17,100 | $79,300 |
Source: Public Records
Map
Nearby Homes
Your Personal Tour Guide
Ask me questions while you tour the home.