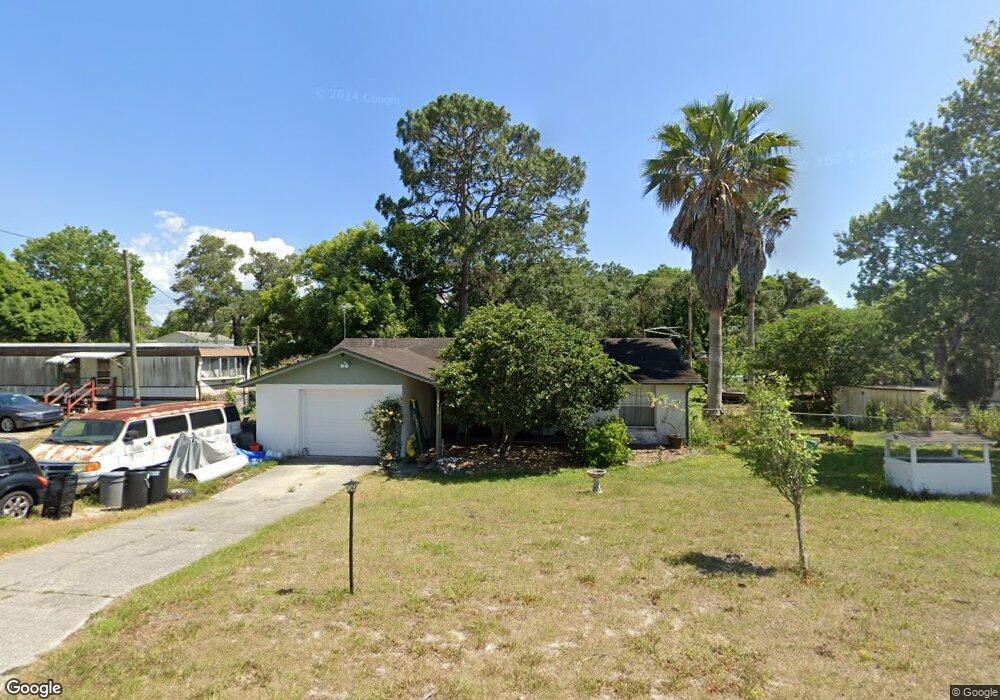
9612 Chris St Hudson, FL 34669
Estimated Value: $177,000 - $247,000
2
Beds
2
Baths
1,872
Sq Ft
$116/Sq Ft
Est. Value
About This Home
This home is located at 9612 Chris St, Hudson, FL 34669 and is currently estimated at $216,814, approximately $115 per square foot. 9612 Chris St is a home located in Pasco County with nearby schools including West Pasco Education Academy, Hudson Middle School, and Fivay High School.
Ownership History
Date
Name
Owned For
Owner Type
Purchase Details
Closed on
Jul 21, 2010
Sold by
Wells Fargo Bank National Association
Bought by
Johnson Douglas and Johnson Delana
Current Estimated Value
Purchase Details
Closed on
Mar 23, 2010
Sold by
Pugh Jesse and Pugh Susan
Bought by
Wells Fargo Bank National Association
Purchase Details
Closed on
Sep 27, 1995
Sold by
Jones Benjamin and Jones Mildred L
Bought by
Pugh Jesse and Pugh Susan
Home Financials for this Owner
Home Financials are based on the most recent Mortgage that was taken out on this home.
Original Mortgage
$50,300
Interest Rate
7.93%
Mortgage Type
Purchase Money Mortgage
Create a Home Valuation Report for This Property
The Home Valuation Report is an in-depth analysis detailing your home's value as well as a comparison with similar homes in the area
Purchase History
We collect this data history from publicly available records. To have your information removed, we recommend requesting removal directly through your county’s website.
| Date | Buyer | Sale Price | Title Company |
|---|---|---|---|
| Johnson Douglas | $37,000 | Fidelity Natl Title Ins Co | |
| Wells Fargo Bank National Association | $20,100 | None Available | |
| Pugh Jesse | $51,900 | -- |
Source: Public Records
Mortgage History
We collect this data history from publicly available records. To have your information removed, we recommend requesting removal directly through your county’s website.
| Date | Status | Borrower | Loan Amount |
|---|---|---|---|
| Previous Owner | Pugh Jesse | $50,300 |
Source: Public Records
Tax History
| Year | Tax Paid | Tax Assessment Tax Assessment Total Assessment is a certain percentage of the fair market value that is determined by local assessors to be the total taxable value of land and additions on the property. | Land | Improvement |
|---|---|---|---|---|
| 2026 | $687 | $57,270 | -- | -- |
| 2025 | $687 | $57,270 | -- | -- |
| 2024 | $687 | $54,100 | -- | -- |
| 2023 | $668 | $52,530 | $0 | $0 |
| 2022 | $621 | $51,000 | $0 | $0 |
| 2021 | $607 | $49,520 | $22,600 | $26,920 |
| 2020 | $589 | $48,840 | $22,600 | $26,240 |
| 2019 | $569 | $47,750 | $0 | $0 |
| 2018 | $549 | $46,861 | $0 | $0 |
| 2017 | $540 | $46,861 | $0 | $0 |
| 2016 | $488 | $44,953 | $0 | $0 |
| 2015 | $592 | $51,493 | $0 | $0 |
| 2014 | $572 | $51,084 | $16,000 | $35,084 |
Source: Public Records
Map
Nearby Homes
- 9708 Andy Dr
- 9506 Andy Dr
- 12415 Parkwood St
- 12242 Parkwood St
- 9634 Pat St
- 12120 Hicks Rd
- 12396 Hicks Rd
- 12506 Hicks Rd
- 12600 Canton Ave
- 9244 Ogalala St
- 12515 Canton Ave
- 9430 Peony St
- 10215 Frierson Lake Dr
- 9405 Loras St
- 9310 Kiowa Dr
- 9444 Loras St
- 9300 Kiowa Dr
- 9300 Teak St
- 9404 Loras St
- TBD Kiowa Dr
Your Personal Tour Guide
Ask me questions while you tour the home.