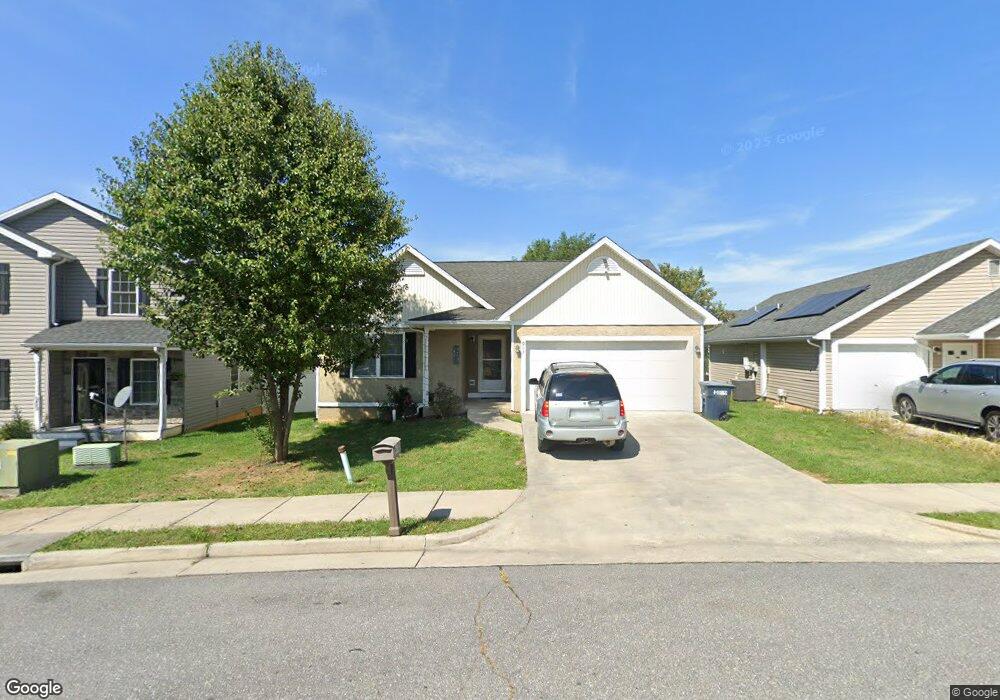
963 Drake St Harrisonburg, VA 22802
Estimated Value: $301,000 - $336,000
3
Beds
2
Baths
1,355
Sq Ft
$231/Sq Ft
Est. Value
About This Home
This home is located at 963 Drake St, Harrisonburg, VA 22802 and is currently estimated at $313,545, approximately $231 per square foot. 963 Drake St is a home located in Harrisonburg City with nearby schools including Waterman Elementary School, Thomas Harrison Middle School, and Harrisonburg High School.
Ownership History
Date
Name
Owned For
Owner Type
Purchase Details
Closed on
Oct 9, 2017
Sold by
U S Bank National Association
Bought by
Karim Ali Yassin Mohammed
Current Estimated Value
Purchase Details
Closed on
Jun 12, 2009
Sold by
Sheets Roy L
Bought by
Arebalo Erazo Carlos D and Lobo Huber E
Home Financials for this Owner
Home Financials are based on the most recent Mortgage that was taken out on this home.
Original Mortgage
$185,576
Interest Rate
5.31%
Mortgage Type
FHA
Purchase Details
Closed on
May 9, 2008
Sold by
Diversified Development Solutions Llc
Bought by
Sheets Roy L
Create a Home Valuation Report for This Property
The Home Valuation Report is an in-depth analysis detailing your home's value as well as a comparison with similar homes in the area
Purchase History
| Date | Buyer | Sale Price | Title Company |
|---|---|---|---|
| Karim Ali Yassin Mohammed | $160,100 | Old Republic National Title | |
| Arebalo Erazo Carlos D | $180,000 | Stewart Title Shenandoah Val | |
| Sheets Roy L | -- | None Available |
Source: Public Records
Mortgage History
| Date | Status | Borrower | Loan Amount |
|---|---|---|---|
| Previous Owner | Arebalo Erazo Carlos D | $185,576 |
Source: Public Records
Tax History
| Year | Tax Paid | Tax Assessment Tax Assessment Total Assessment is a certain percentage of the fair market value that is determined by local assessors to be the total taxable value of land and additions on the property. | Land | Improvement |
|---|---|---|---|---|
| 2025 | $2,788 | $282,400 | $46,200 | $236,200 |
| 2024 | $2,788 | $276,000 | $44,000 | $232,000 |
| 2023 | $2,330 | $242,700 | $35,200 | $207,500 |
| 2022 | $2,032 | $218,500 | $32,000 | $186,500 |
| 2021 | $1,775 | $197,200 | $32,000 | $165,200 |
| 2020 | $1,590 | $181,400 | $32,000 | $149,400 |
| 2019 | $1,590 | $181,400 | $32,000 | $149,400 |
| 2018 | $1,174 | $176,200 | $32,000 | $144,200 |
| 2017 | $1,174 | $160,100 | $32,000 | $128,100 |
| 2016 | $1,174 | $160,100 | $32,000 | $128,100 |
| 2015 | $1,174 | $163,100 | $35,000 | $128,100 |
| 2014 | -- | $167,900 | $37,000 | $130,900 |
Source: Public Records
Map
Nearby Homes
- 945 Drake Ln
- 909 Jefferson St
- 926 Jefferson St
- 787 N Liberty St
- 919 Collicello St
- 195 5th St
- 619 Broad St
- 1301 Owen Ln
- 1305 Owen Ln
- 1309 Owen Ln
- 1313 Owen Ln
- 1304 Luke Ln
- 1308 Luke Ln
- 1621 Woodrow Cir
- 1617 Woodrow Cir
- 1201 Wordsworth Ct
- 1613 Woodrow Cir
- 1321 Owen Ln
- 667 Northfield Ct
- 1412 Rainn Place
Your Personal Tour Guide
Ask me questions while you tour the home.