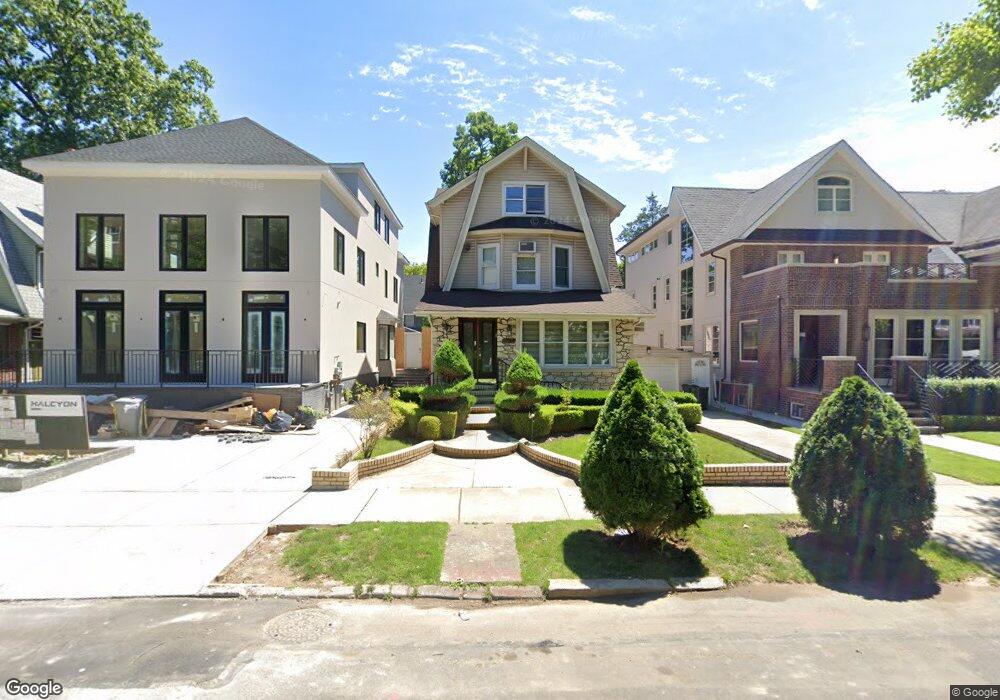
963 E 17th St Brooklyn, NY 11230
Midwood NeighborhoodEstimated Value: $1,535,000 - $1,982,000
Studio
--
Bath
2,458
Sq Ft
$707/Sq Ft
Est. Value
About This Home
This home is located at 963 E 17th St, Brooklyn, NY 11230 and is currently estimated at $1,737,464, approximately $706 per square foot. 963 E 17th St is a home located in Kings County with nearby schools including School of Science and Technology, P.S. 315, and Jhs 234 Arthur W Cunningham.
Ownership History
Date
Name
Owned For
Owner Type
Purchase Details
Closed on
Jul 12, 2023
Sold by
Wajsbaum Akiva and Wajsbaum Joshua
Bought by
Schwebel Adina H and Schwebel Yeshaya D
Current Estimated Value
Home Financials for this Owner
Home Financials are based on the most recent Mortgage that was taken out on this home.
Original Mortgage
$1,155,000
Outstanding Balance
$1,124,601
Interest Rate
6.69%
Mortgage Type
Purchase Money Mortgage
Estimated Equity
$612,863
Purchase Details
Closed on
Jul 31, 2006
Sold by
Estate Of Barbara Wajsbaum and Weingarten
Bought by
Wajsbaum Akiva and Wajsbaum Joshua
Purchase Details
Closed on
Oct 1, 1998
Sold by
Herssein Ignacio and Herssein Daniel
Bought by
Wajsbaum Barbara
Home Financials for this Owner
Home Financials are based on the most recent Mortgage that was taken out on this home.
Original Mortgage
$227,000
Interest Rate
6.78%
Mortgage Type
Purchase Money Mortgage
Create a Home Valuation Report for This Property
The Home Valuation Report is an in-depth analysis detailing your home's value as well as a comparison with similar homes in the area
Home Values in the Area
Average Home Value in this Area
Purchase History
| Date | Buyer | Sale Price | Title Company |
|---|---|---|---|
| Schwebel Adina H | $1,540,000 | -- | |
| Schwebel Adina H | $1,540,000 | -- | |
| Schwebel Adina H | $1,540,000 | -- | |
| Wajsbaum Akiva | -- | -- | |
| Wajsbaum Akiva | -- | -- | |
| Wajsbaum Barbara | $399,000 | Stewart Title Insurance Co | |
| Wajsbaum Barbara | $399,000 | Stewart Title Insurance Co |
Source: Public Records
Mortgage History
| Date | Status | Borrower | Loan Amount |
|---|---|---|---|
| Open | Schwebel Adina H | $1,155,000 | |
| Closed | Schwebel Adina H | $1,155,000 | |
| Previous Owner | Wajsbaum Barbara | $227,000 |
Source: Public Records
Tax History
| Year | Tax Paid | Tax Assessment Tax Assessment Total Assessment is a certain percentage of the fair market value that is determined by local assessors to be the total taxable value of land and additions on the property. | Land | Improvement |
|---|---|---|---|---|
| 2025 | $12,154 | $85,380 | $26,760 | $58,620 |
| 2024 | $12,154 | $94,680 | $26,760 | $67,920 |
| 2023 | $12,088 | $89,520 | $26,760 | $62,760 |
| 2022 | $11,882 | $75,240 | $26,760 | $48,480 |
| 2021 | $11,819 | $82,500 | $26,760 | $55,740 |
| 2020 | $11,249 | $97,800 | $26,760 | $71,040 |
| 2019 | $10,549 | $97,800 | $26,760 | $71,040 |
| 2018 | $10,111 | $49,598 | $19,353 | $30,245 |
| 2017 | $10,111 | $49,598 | $20,849 | $28,749 |
| 2016 | $9,356 | $46,800 | $18,229 | $28,571 |
| 2015 | $5,643 | $44,544 | $25,879 | $18,665 |
| 2014 | $5,643 | $42,024 | $25,430 | $16,594 |
Source: Public Records
Map
Nearby Homes
- 1620 Avenue I Unit 307
- 1620 Avenue I Unit 502
- 1615 Avenue I Unit 511
- 1615 Avenue I Unit 411
- 1615 Avenue I Unit 102
- 941 E 15th St
- 945 E 15th St
- 915 E 17th St Unit 116
- 915 E 17th St Unit 214
- 915 E 17th St Unit 316
- 915 E 17th St Unit 114
- 920 E 17th St Unit 518
- 920 E 17th St Unit 609
- 870 E 16th St Unit 4
- 1049 E 18th St
- 1401 Ocean Ave Unit 12B
- 1401 Ocean Ave Unit 11A
- 1375 Ocean Ave Unit 5J
- 1504 Ocean Ave Unit 2A
- 1710 Ave H Unit F6
- 967 E 17th St
- 959 E 17th St
- 945-955 E 17th St
- 971 E 17th St
- 945 E 17th St Unit 955
- 960 E 18th St
- 966 E 18th St
- 956 E 18th St
- 975 E 17th St
- 975 E 17th St Unit 609
- 970 E 18th St
- 952 E 18th St
- 1710 Avenue I
- 950 E 17th St
- 951 E 17th St
- 974 E 18th St
- 946 E 18th St
- 977 E 17th St
- 980 E 18th St
- 970 E 17th St
Your Personal Tour Guide
Ask me questions while you tour the home.