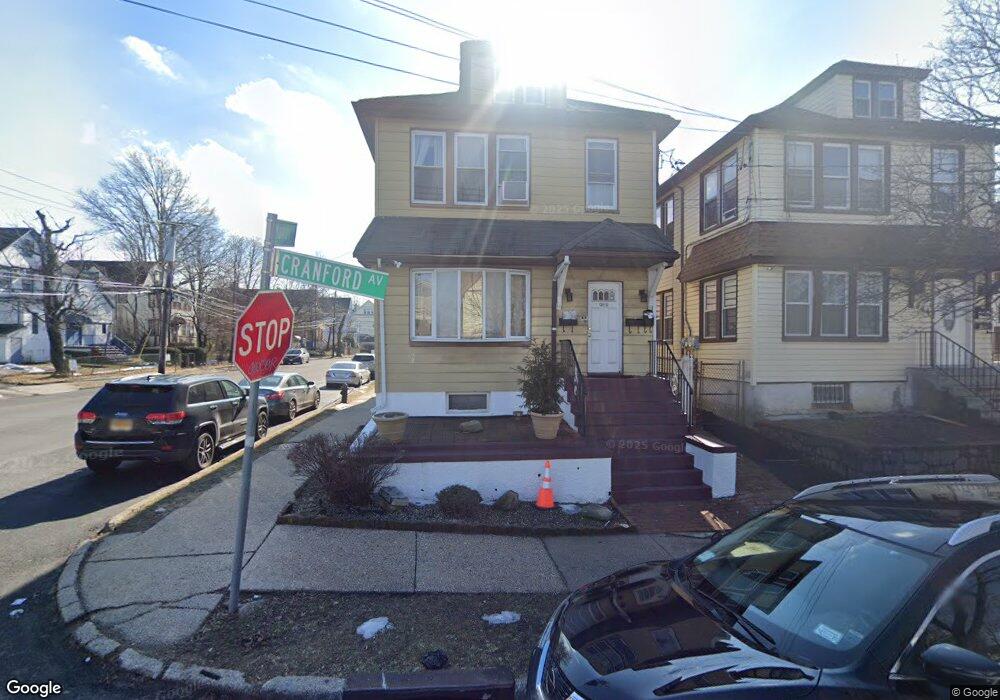
968 Cranford Ave Bronx, NY 10466
Wakefield NeighborhoodEstimated Value: $705,873 - $842,000
Studio
--
Bath
2,240
Sq Ft
$345/Sq Ft
Est. Value
About This Home
This home is located at 968 Cranford Ave, Bronx, NY 10466 and is currently estimated at $773,218, approximately $345 per square foot. 968 Cranford Ave is a home located in Bronx County with nearby schools including P.S. 68 - Bronx, Baychester Middle School, and One World Middle School At Edenwald.
Ownership History
Date
Name
Owned For
Owner Type
Purchase Details
Closed on
Jan 3, 2002
Sold by
Better Homes Depot Of Th
Bought by
Maxwell Richards S
Current Estimated Value
Home Financials for this Owner
Home Financials are based on the most recent Mortgage that was taken out on this home.
Original Mortgage
$41,250
Outstanding Balance
$16,811
Interest Rate
7.15%
Estimated Equity
$756,407
Purchase Details
Closed on
Nov 13, 2001
Sold by
Mcfarlane-Vaughn Yasmin and Sfirlogeanu Marian Deft
Bought by
Better Homes Depot
Home Financials for this Owner
Home Financials are based on the most recent Mortgage that was taken out on this home.
Original Mortgage
$220,000
Outstanding Balance
$88,708
Interest Rate
7.15%
Estimated Equity
$684,510
Purchase Details
Closed on
Apr 12, 1996
Sold by
Maxwell Lincoln A and Malcolm Dawn L
Bought by
Sfirlogeanu Marian
Home Financials for this Owner
Home Financials are based on the most recent Mortgage that was taken out on this home.
Original Mortgage
$171,000
Interest Rate
7.81%
Create a Home Valuation Report for This Property
The Home Valuation Report is an in-depth analysis detailing your home's value as well as a comparison with similar homes in the area
Home Values in the Area
Average Home Value in this Area
Purchase History
| Date | Buyer | Sale Price | Title Company |
|---|---|---|---|
| Maxwell Richards S | -- | -- | |
| Better Homes Depot | -- | -- | |
| Sfirlogeanu Marian | $195,000 | -- |
Source: Public Records
Mortgage History
| Date | Status | Borrower | Loan Amount |
|---|---|---|---|
| Open | Maxwell Richards S | $41,250 | |
| Open | Maxwell Richards S | $220,000 | |
| Previous Owner | Better Homes Depot | $220,000 | |
| Previous Owner | Sfirlogeanu Marian | $171,000 |
Source: Public Records
Tax History
| Year | Tax Paid | Tax Assessment Tax Assessment Total Assessment is a certain percentage of the fair market value that is determined by local assessors to be the total taxable value of land and additions on the property. | Land | Improvement |
|---|---|---|---|---|
| 2025 | $7,052 | $37,216 | $7,157 | $30,059 |
| 2024 | $7,052 | $35,110 | $6,944 | $28,166 |
| 2023 | $6,727 | $33,125 | $7,571 | $25,554 |
| 2022 | $6,239 | $42,660 | $9,600 | $33,060 |
| 2021 | $6,577 | $40,800 | $9,600 | $31,200 |
| 2020 | $6,565 | $40,800 | $9,600 | $31,200 |
| 2019 | $6,121 | $33,300 | $9,600 | $23,700 |
| 2018 | $5,627 | $27,604 | $7,398 | $20,206 |
| 2017 | $5,309 | $26,043 | $9,322 | $16,721 |
| 2016 | $5,206 | $26,043 | $9,098 | $16,945 |
| 2015 | $2,963 | $25,844 | $9,829 | $16,015 |
| 2014 | $2,963 | $24,382 | $9,538 | $14,844 |
Source: Public Records
Map
Nearby Homes
- 225 S 11th Ave
- 206 S 9th Ave
- 309 Mundy Ln Unit 309
- 4519 Seton Ave
- 562 S 9th Ave
- 4612 Monticello Ave
- 149 S 10th Ave
- 345-351 S 9th Ave
- 4525 Monticello Ave
- 327 Mundy Ln
- 999 E 241st St
- 130 S 9th Ave
- 148 S 13th Ave
- 349 Mundy Ln
- 4450 Hill Ave
- 354 S 10th Ave
- 137 S 14th Ave
- 219 S 6th Ave
- 109 S 12th Ave
- 238 S 5th Ave
- 966 Cranford Ave
- 958 Cranford Ave
- 4535 Mundy Ln
- 4533 Mundy Ln
- 956 Cranford Ave
- 343 Mundy Ln
- 4531 Mundy Ln
- 4531 Mundy Ln Unit 2
- 954 Cranford Ave
- 4529 Mundy Ln
- 952 Cranford Ave
- 4528 Seton Ave
- 235 S 11th Ave
- 230 S 11th Ave
- 4526 Seton Ave
- 950 Cranford Ave
- 231 S 11th Ave
- 4524 Seton Ave
- 4600 Seton Ave
- 249 S 11th Ave
Your Personal Tour Guide
Ask me questions while you tour the home.