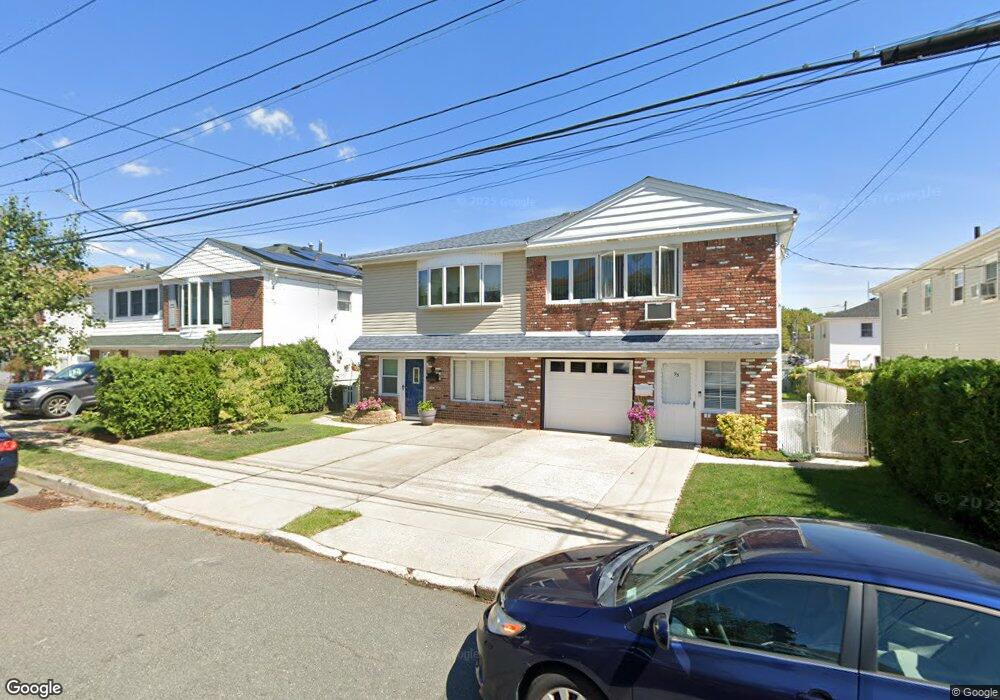
97 E Broadway Staten Island, NY 10306
Oakwood NeighborhoodEstimated Value: $632,000 - $809,000
Studio
4
Baths
1,480
Sq Ft
$486/Sq Ft
Est. Value
About This Home
This home is located at 97 E Broadway, Staten Island, NY 10306 and is currently estimated at $718,692, approximately $485 per square foot. 97 E Broadway is a home located in Richmond County with nearby schools including P.S. 23 Richmondtown, Myra S. Barnes Intermediate School 24, and New Dorp High School.
Ownership History
Date
Name
Owned For
Owner Type
Purchase Details
Closed on
Nov 9, 2015
Sold by
Rice Karen Ann and Estate Of Madeline Mccolgan
Bought by
Phillips Thomas and Phillips Joyce
Current Estimated Value
Home Financials for this Owner
Home Financials are based on the most recent Mortgage that was taken out on this home.
Original Mortgage
$200,000
Outstanding Balance
$157,310
Interest Rate
3.79%
Mortgage Type
New Conventional
Estimated Equity
$561,382
Create a Home Valuation Report for This Property
The Home Valuation Report is an in-depth analysis detailing your home's value as well as a comparison with similar homes in the area
Home Values in the Area
Average Home Value in this Area
Purchase History
| Date | Buyer | Sale Price | Title Company |
|---|---|---|---|
| Phillips Thomas | $250,000 | First American Title Ins Co |
Source: Public Records
Mortgage History
| Date | Status | Borrower | Loan Amount |
|---|---|---|---|
| Open | Phillips Thomas | $200,000 |
Source: Public Records
Tax History
| Year | Tax Paid | Tax Assessment Tax Assessment Total Assessment is a certain percentage of the fair market value that is determined by local assessors to be the total taxable value of land and additions on the property. | Land | Improvement |
|---|---|---|---|---|
| 2025 | $7,102 | $37,020 | $9,061 | $27,959 |
| 2024 | $7,102 | $39,540 | $8,317 | $31,223 |
| 2023 | $6,775 | $33,360 | $7,472 | $25,888 |
| 2022 | $6,339 | $39,120 | $9,300 | $29,820 |
| 2021 | $6,326 | $35,280 | $9,300 | $25,980 |
| 2020 | $6,362 | $34,200 | $9,300 | $24,900 |
| 2019 | $6,172 | $31,740 | $9,300 | $22,440 |
| 2018 | $5,667 | $27,800 | $7,134 | $20,666 |
| 2017 | $5,394 | $26,460 | $9,300 | $17,160 |
| 2016 | $5,007 | $25,048 | $8,864 | $16,184 |
| 2015 | $1,602 | $25,048 | $7,693 | $17,355 |
| 2014 | $1,602 | $24,556 | $7,232 | $17,324 |
Source: Public Records
Map
Nearby Homes
- 42 Amber St
- 56 Wolverine St
- 223 Park St
- 143 Wolverine St
- 103 Dalton Ave
- 61 Natick St
- 160 Wolverine St
- 26 Altoona Ave
- 174 Barbara St
- 110 Bishop St
- 62 Morton St
- 57 Joel Place
- 53 Morton St
- 133 Ardsley St
- 169 Pinewood Ave
- 183 Natick St
- 132 Cedarview Ave
- 236 Amber St
- 45 Francine Ct Unit B
- 12 Clarence Place
Your Personal Tour Guide
Ask me questions while you tour the home.