970 Main St Hackensack, NJ 07601
Estimated Value: $271,000 - $285,000
Studio
--
Bath
670
Sq Ft
$416/Sq Ft
Est. Value
About This Home
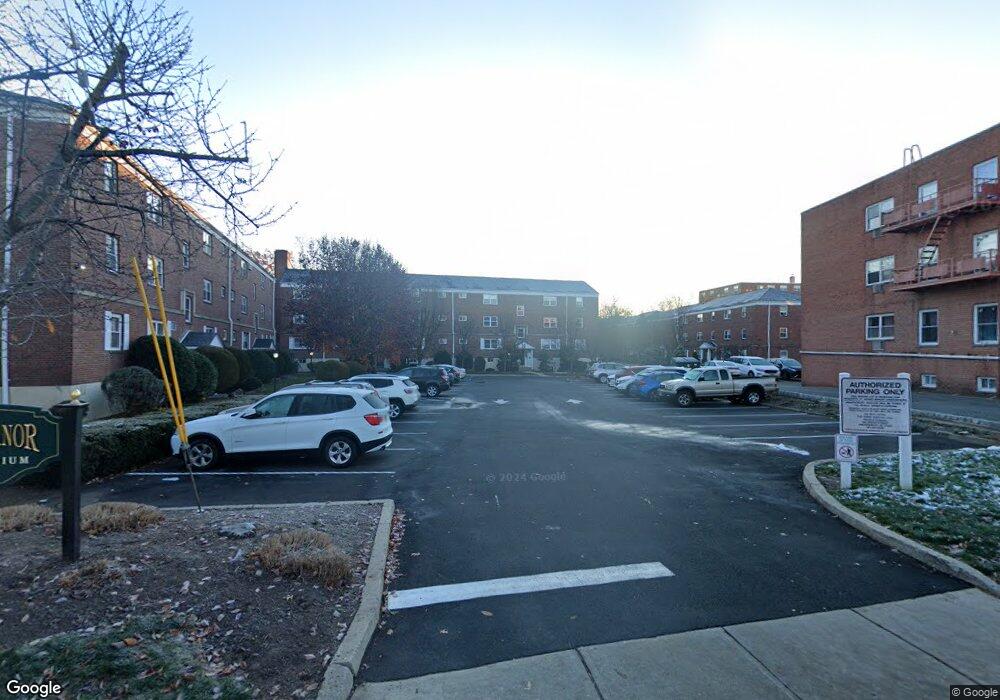
This home is located at 970 Main St, Hackensack, NJ 07601 and is currently estimated at $278,810, approximately $416 per square foot. 970 Main St is a home located in Bergen County with nearby schools including Hackensack High School, Bergen County Christian Academy, and Ben Porat Yosef.
Ownership History
Date
Name
Owned For
Owner Type
Purchase Details
Closed on
Feb 14, 2022
Sold by
Jackson and Angelica
Bought by
Fantozzi Cathryn
Current Estimated Value
Home Financials for this Owner
Home Financials are based on the most recent Mortgage that was taken out on this home.
Original Mortgage
$175,500
Outstanding Balance
$163,239
Interest Rate
3.69%
Mortgage Type
New Conventional
Estimated Equity
$115,571
Purchase Details
Closed on
Feb 12, 2004
Sold by
Trujillo Jason W
Bought by
Jackson Marvin and Jackson Angelica
Home Financials for this Owner
Home Financials are based on the most recent Mortgage that was taken out on this home.
Original Mortgage
$122,400
Interest Rate
5.62%
Purchase Details
Closed on
Jul 25, 2002
Sold by
Smajlaj Luis
Bought by
Trujillo Jason W and Abate Lauren E
Home Financials for this Owner
Home Financials are based on the most recent Mortgage that was taken out on this home.
Original Mortgage
$112,000
Interest Rate
6.73%
Purchase Details
Closed on
May 2, 2002
Sold by
Deibel Joseph
Bought by
Smajlaj Lush
Create a Home Valuation Report for This Property
The Home Valuation Report is an in-depth analysis detailing your home's value as well as a comparison with similar homes in the area
Home Values in the Area
Average Home Value in this Area
Purchase History
| Date | Buyer | Sale Price | Title Company |
|---|---|---|---|
| Fantozzi Cathryn | $195,000 | Chicago Title | |
| Jackson Marvin | $153,000 | -- | |
| Trujillo Jason W | $140,000 | -- | |
| Smajlaj Lush | $87,000 | -- |
Source: Public Records
Mortgage History
| Date | Status | Borrower | Loan Amount |
|---|---|---|---|
| Open | Fantozzi Cathryn | $175,500 | |
| Previous Owner | Jackson Marvin | $122,400 | |
| Previous Owner | Trujillo Jason W | $112,000 |
Source: Public Records
Tax History
| Year | Tax Paid | Tax Assessment Tax Assessment Total Assessment is a certain percentage of the fair market value that is determined by local assessors to be the total taxable value of land and additions on the property. | Land | Improvement |
|---|---|---|---|---|
| 2025 | $5,629 | $184,200 | $90,000 | $94,200 |
| 2024 | $5,303 | $184,200 | $90,000 | $94,200 |
| 2023 | $5,004 | $184,200 | $90,000 | $94,200 |
| 2022 | $5,004 | $178,600 | $85,000 | $93,600 |
| 2021 | $4,141 | $123,400 | $75,500 | $47,900 |
| 2020 | $4,083 | $123,400 | $75,500 | $47,900 |
| 2019 | $4,257 | $126,800 | $74,000 | $52,800 |
| 2018 | $3,935 | $115,300 | $62,500 | $52,800 |
| 2017 | $3,750 | $109,800 | $60,000 | $49,800 |
| 2016 | $4,033 | $119,400 | $70,000 | $49,400 |
| 2015 | $5,443 | $155,500 | $51,300 | $104,200 |
| 2014 | $5,166 | $155,500 | $51,300 | $104,200 |
Source: Public Records
Map
Nearby Homes
- 245 Johnson Ave Unit K1
- 241 Johnson Ave Unit N2
- 25 Jefferson St Unit 4E
- 25 Jefferson St Unit 3D
- 16 Jefferson St
- 980 Main St Unit C1
- 15 Zabriskie St Unit 1505
- 30 Willow Ave
- 32 Martin Terrace
- 55 Rutgers Place
- 95 Cedar Ave
- 67 Spring Valley Ave
- 133 Willow Ave
- 120 Louis St
- 75 Pine St
- 150 Grand Ave Unit 1A
- 81 Fairmount Ave
- 181 Allen St
- 149 Allen St
- 255 Bogert Rd Unit 2A
- 970 Main St
- 970 Main St
- 970 Main St
- 970 Main St
- 970 Main St
- 970 Main St Unit H4
- 970 Main St Unit H5
- 970 Main St Unit H3
- 247 Johnson Ave Unit C00J3
- 247 Johnson Ave
- 247 Johnson Ave
- 247 Johnson Ave
- 247 Johnson Ave
- 247 Johnson Ave
- 247 Johnson Ave Unit J5
- 247 Johnson Ave Unit J3
- 247 Johnson Ave Unit J1
- 972 Main St
- 972 Main St
- 972 Main St
Your Personal Tour Guide
Ask me questions while you tour the home.