9715 Pebble View Dr Cincinnati, OH 45252
Estimated Value: $470,649 - $547,000
3
Beds
3
Baths
2,681
Sq Ft
$191/Sq Ft
Est. Value
About This Home
This home is located at 9715 Pebble View Dr, Cincinnati, OH 45252 and is currently estimated at $512,162, approximately $191 per square foot. 9715 Pebble View Dr is a home located in Hamilton County with nearby schools including Colerain Elementary School, Colerain Middle School, and Colerain High School.
Ownership History
Date
Name
Owned For
Owner Type
Purchase Details
Closed on
May 14, 2019
Sold by
Cook Jeffrey Lane and Cook Nancy Jean
Bought by
Cook Jeffrey Lane and Cook Nancy Jean
Current Estimated Value
Purchase Details
Closed on
Sep 23, 2005
Sold by
Eagle Golf Inc
Bought by
Cook Jeffery Lane and Cook Nancy Jean
Create a Home Valuation Report for This Property
The Home Valuation Report is an in-depth analysis detailing your home's value as well as a comparison with similar homes in the area
Home Values in the Area
Average Home Value in this Area
Purchase History
| Date | Buyer | Sale Price | Title Company |
|---|---|---|---|
| Cook Jeffrey Lane | -- | None Available | |
| Cook Jeffery Lane | $120,000 | None Available |
Source: Public Records
Tax History
| Year | Tax Paid | Tax Assessment Tax Assessment Total Assessment is a certain percentage of the fair market value that is determined by local assessors to be the total taxable value of land and additions on the property. | Land | Improvement |
|---|---|---|---|---|
| 2025 | $7,939 | $148,187 | $38,500 | $109,687 |
| 2024 | $7,364 | $148,187 | $38,500 | $109,687 |
| 2023 | $7,451 | $148,187 | $38,500 | $109,687 |
| 2022 | $7,200 | $118,307 | $38,150 | $80,157 |
| 2021 | $7,127 | $118,307 | $38,150 | $80,157 |
| 2020 | $7,215 | $118,307 | $38,150 | $80,157 |
| 2019 | $7,036 | $108,539 | $35,000 | $73,539 |
| 2018 | $6,309 | $108,539 | $35,000 | $73,539 |
| 2017 | $5,968 | $108,539 | $35,000 | $73,539 |
| 2016 | $4,333 | $80,325 | $35,000 | $45,325 |
| 2015 | $4,384 | $80,325 | $35,000 | $45,325 |
| 2014 | $4,391 | $80,325 | $35,000 | $45,325 |
| 2013 | $4,179 | $80,325 | $35,000 | $45,325 |
Source: Public Records
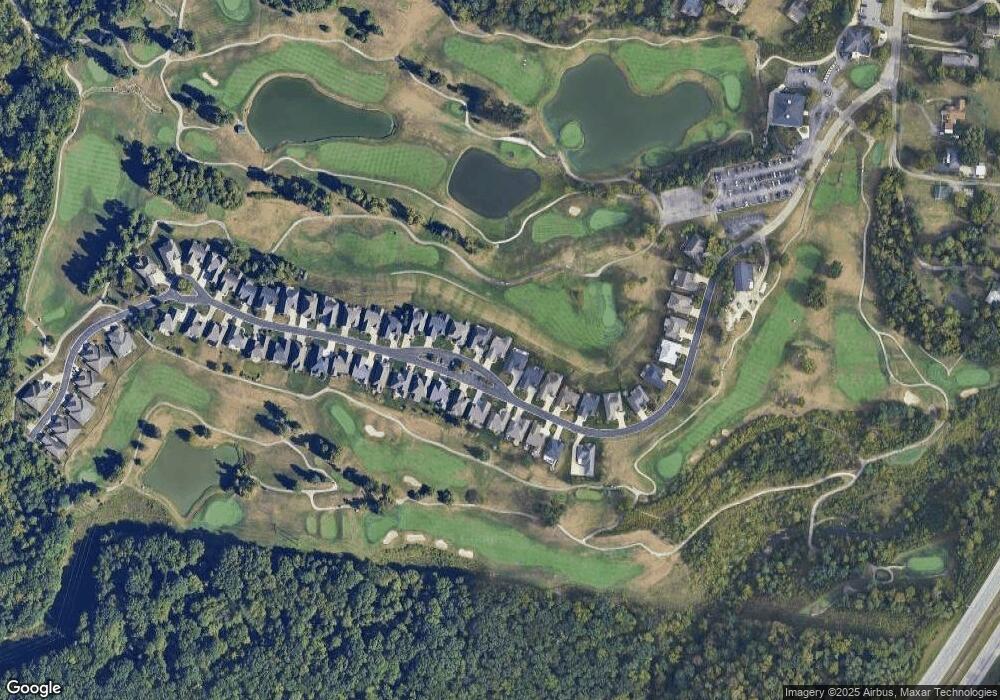
Map
Nearby Homes
- 9873 Kittywood Dr
- 9801 Regatta Dr
- 9905 Regatta Dr
- 4281 Defender Dr
- 4221 Endeavor Dr
- 4230 Endeavor Dr Unit 101
- 4187 Intrepid Dr Unit 38
- 3724 Yellowstone Dr
- 4086 Resolute Cir Unit 481
- 3834 Enterprise Cir
- 4002 Resolute Cir
- 9981 Skyridge Dr
- 3918 Enterprise Cir Unit 532
- 5630 Dry Ridge Rd
- 3875 Woodsong Dr
- 3760 Brockton Dr
- 10263 Colerain Ave
- 9952 Capstan Dr
- 9917 Capstan Dr
- 8877 Wuest Rd
- 9711 Pebble View Dr
- 9719 Pebble View Dr
- 9727 Pebble View Dr
- 9705 Pebble View Dr
- 9712 Pebble View Dr
- 9708 Pebble View Dr
- 9731 Pebble View Dr
- 9701 Pebble View Dr
- 9716 Pebble View Dr
- 9704 Pebble View Dr
- 9722 Pebble View Dr
- 9700 Pebble View Dr
- 9735 Pebble View Dr
- 9695 Pebble View Dr
- 9728 Pebble View Dr
- 33 Pebble View Dr
- 26 Pebble View Dr
- 46 Pebble View Dr
- 27 Pebble View Dr
- 42 Pebble View Dr
Your Personal Tour Guide
Ask me questions while you tour the home.