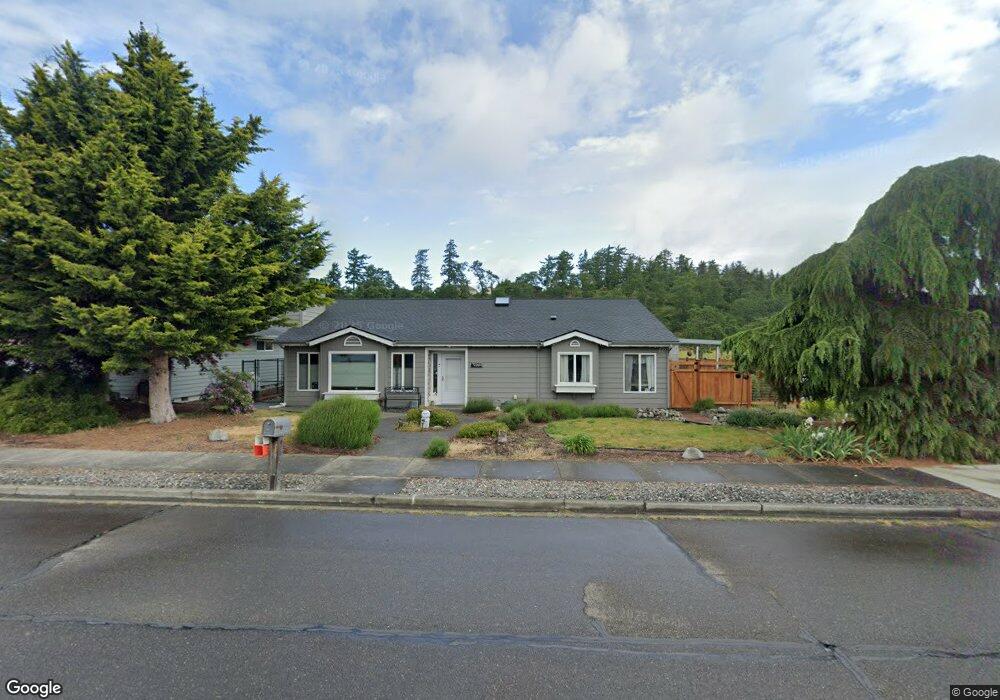
972 E Willow St Sequim, WA 98382
Estimated Value: $485,403 - $523,000
3
Beds
2
Baths
1,588
Sq Ft
$320/Sq Ft
Est. Value
About This Home
This home is located at 972 E Willow St, Sequim, WA 98382 and is currently estimated at $507,468, approximately $319 per square foot. 972 E Willow St is a home located in Clallam County with nearby schools including Helen Haller Elementary School, Sequim Middle School, and Sequim Senior High School.
Ownership History
Date
Name
Owned For
Owner Type
Purchase Details
Closed on
Jan 7, 2009
Sold by
Sumpter Maston E
Bought by
Burrows Rich C and Burrows Barbara L
Current Estimated Value
Home Financials for this Owner
Home Financials are based on the most recent Mortgage that was taken out on this home.
Original Mortgage
$199,000
Outstanding Balance
$128,579
Interest Rate
5.6%
Mortgage Type
New Conventional
Estimated Equity
$378,889
Purchase Details
Closed on
Jun 14, 2005
Sold by
Klahn Jean B
Bought by
Sumpter Maston E
Home Financials for this Owner
Home Financials are based on the most recent Mortgage that was taken out on this home.
Original Mortgage
$119,000
Interest Rate
5.72%
Mortgage Type
New Conventional
Create a Home Valuation Report for This Property
The Home Valuation Report is an in-depth analysis detailing your home's value as well as a comparison with similar homes in the area
Purchase History
| Date | Buyer | Sale Price | Title Company |
|---|---|---|---|
| Burrows Rich C | $249,000 | Olympic Peninsula Title Co | |
| Sumpter Maston E | $249,000 | None Available |
Source: Public Records
Mortgage History
| Date | Status | Borrower | Loan Amount |
|---|---|---|---|
| Open | Burrows Rich C | $199,000 | |
| Previous Owner | Sumpter Maston E | $119,000 |
Source: Public Records
Tax History
| Year | Tax Paid | Tax Assessment Tax Assessment Total Assessment is a certain percentage of the fair market value that is determined by local assessors to be the total taxable value of land and additions on the property. | Land | Improvement |
|---|---|---|---|---|
| 2025 | $3,142 | $421,141 | $116,000 | $305,141 |
| 2023 | $3,142 | $415,677 | $110,400 | $305,277 |
| 2022 | $3,028 | $397,277 | $92,000 | $305,277 |
| 2021 | $2,840 | $302,493 | $75,000 | $227,493 |
| 2020 | $2,973 | $302,493 | $75,000 | $227,493 |
| 2018 | $2,364 | $254,601 | $54,180 | $200,421 |
| 2017 | $2,005 | $206,064 | $54,180 | $151,884 |
| 2016 | $2,005 | $206,374 | $54,180 | $152,194 |
| 2015 | $2,005 | $194,022 | $54,180 | $139,842 |
| 2013 | $2,005 | $173,030 | $54,180 | $118,850 |
| 2012 | $2,005 | $198,742 | $63,000 | $135,742 |
Source: Public Records
Map
Nearby Homes
- 812 E Spruce St
- 340 N Dunlap Ave
- 310 Solana Pkwy
- 999 S Brown Rd
- 225 N Matriotti Ave
- 90 Dover Ln
- 151 Dover Ln
- 21 Dover Ln
- 70 Dover Ln
- 111 Dover Ln
- 121 Dover Ln
- 991 E Hammond St
- 0 N Knapman Ave
- NKA N Knapman Ave
- 550 N Sequim Ave
- 81 Cambridge Terrace
- 866 N Rock Rose Ave Unit N Rock Rose Ave
- 866 N Rock Rose Ave
- 886 N Rock Rose Ave
- 896 N Rock Rose Ave
Your Personal Tour Guide
Ask me questions while you tour the home.