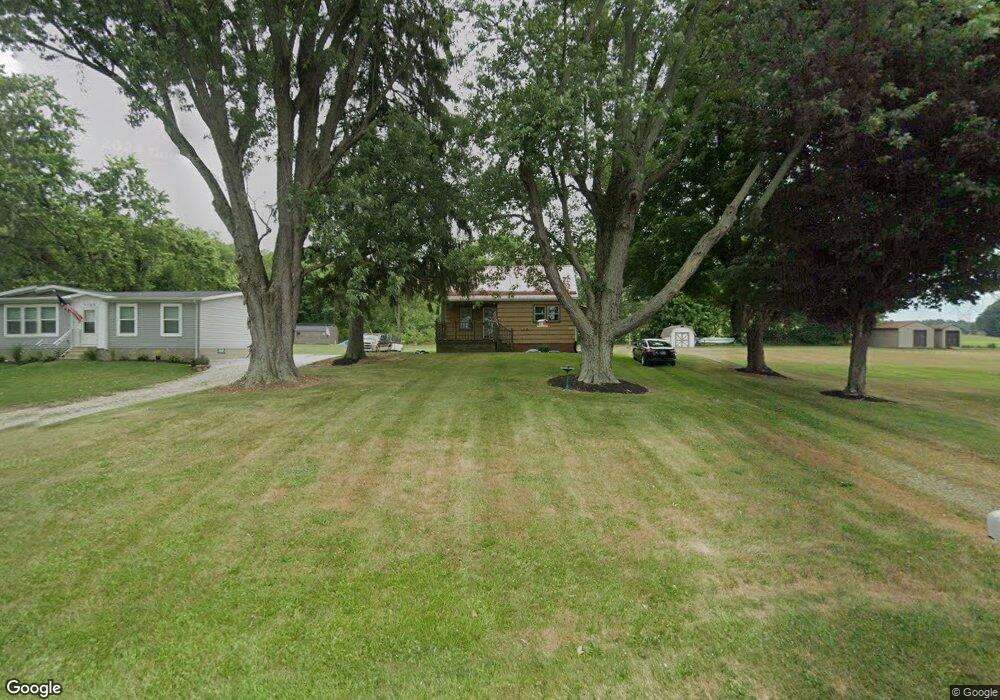
9781 Mapleton St SE East Canton, OH 44730
Estimated Value: $123,000 - $146,000
3
Beds
1
Bath
1,080
Sq Ft
$122/Sq Ft
Est. Value
About This Home
This home is located at 9781 Mapleton St SE, East Canton, OH 44730 and is currently estimated at $131,448, approximately $121 per square foot. 9781 Mapleton St SE is a home located in Stark County with nearby schools including East Canton Elementary School, East Canton Middle School, and East Canton High School.
Ownership History
Date
Name
Owned For
Owner Type
Purchase Details
Closed on
Jun 27, 2005
Sold by
Clark Debra Kay
Bought by
Clark Bierce G
Current Estimated Value
Purchase Details
Closed on
Jul 5, 1994
Sold by
Neville Victor K
Bought by
Clark Bierce G and Clark Debra K
Home Financials for this Owner
Home Financials are based on the most recent Mortgage that was taken out on this home.
Original Mortgage
$55,800
Interest Rate
8.66%
Mortgage Type
New Conventional
Purchase Details
Closed on
Dec 10, 1991
Create a Home Valuation Report for This Property
The Home Valuation Report is an in-depth analysis detailing your home's value as well as a comparison with similar homes in the area
Purchase History
| Date | Buyer | Sale Price | Title Company |
|---|---|---|---|
| Clark Bierce G | -- | None Available | |
| Clark Bierce G | $62,000 | -- | |
| -- | $20,200 | -- |
Source: Public Records
Mortgage History
| Date | Status | Borrower | Loan Amount |
|---|---|---|---|
| Closed | Clark Bierce G | $55,800 |
Source: Public Records
Tax History
| Year | Tax Paid | Tax Assessment Tax Assessment Total Assessment is a certain percentage of the fair market value that is determined by local assessors to be the total taxable value of land and additions on the property. | Land | Improvement |
|---|---|---|---|---|
| 2025 | -- | $31,470 | $9,940 | $21,530 |
| 2024 | -- | $31,470 | $9,940 | $21,530 |
| 2023 | $1,005 | $26,740 | $7,210 | $19,530 |
| 2022 | $986 | $26,740 | $7,210 | $19,530 |
| 2021 | $989 | $26,740 | $7,210 | $19,530 |
| 2020 | $984 | $24,220 | $6,580 | $17,640 |
| 2019 | $965 | $24,220 | $6,580 | $17,640 |
Source: Public Records
Map
Nearby Homes
- 10400 Lincoln St SE
- 11294 Lincoln St SE
- 11304 Peachlane St SE
- 3929 Robertsville Ave SE
- 0000 Ravenna Chapel Ave SE
- 7231 Bluebird Rd NW Unit 2W
- 7091 Bluebird Rd NW Unit 2W
- 8114 Lisbon St E
- 0 Lincoln St SE Unit 5157308
- 0 Lincoln St SE Unit 5157344
- 8155 Westfall St SE
- 4293 Legend Rd NW
- 226 Liberty St E
- 318 Wood St N
- 231 Cedar St N
- 137 Noble St W
- 9265 Georgetown St
- 2425 Miday Ave NE
- 403 Nassau St W
- 0 Blade Rd NW
- 9759 Mapleton St SE
- 9769 Mapleton St SE
- 9841 Mapleton St SE
- 9687 Mapleton St SE
- 9675 Mapleton St SE
- 9863 Mapleton St SE
- 9888 Mapleton St SE
- 9995 Mapleton St SE
- 9695 Weimer Dr SE
- 9580 Mapleton St SE
- 3011 Sam Krabill Ave SE
- 9697 Weimer Dr SE
- 9634 Weimer Dr SE
- 0 Weimer Dr SE Unit 3990733
- 0 Weimer Dr SE Unit 3649160
- V/L Weimer Dr SE
- 9576 Weimer Dr SE
- 9970 Mapleton St SE
- 9539 Mapleton St SE
- 10039 Mapleton St SE
Your Personal Tour Guide
Ask me questions while you tour the home.