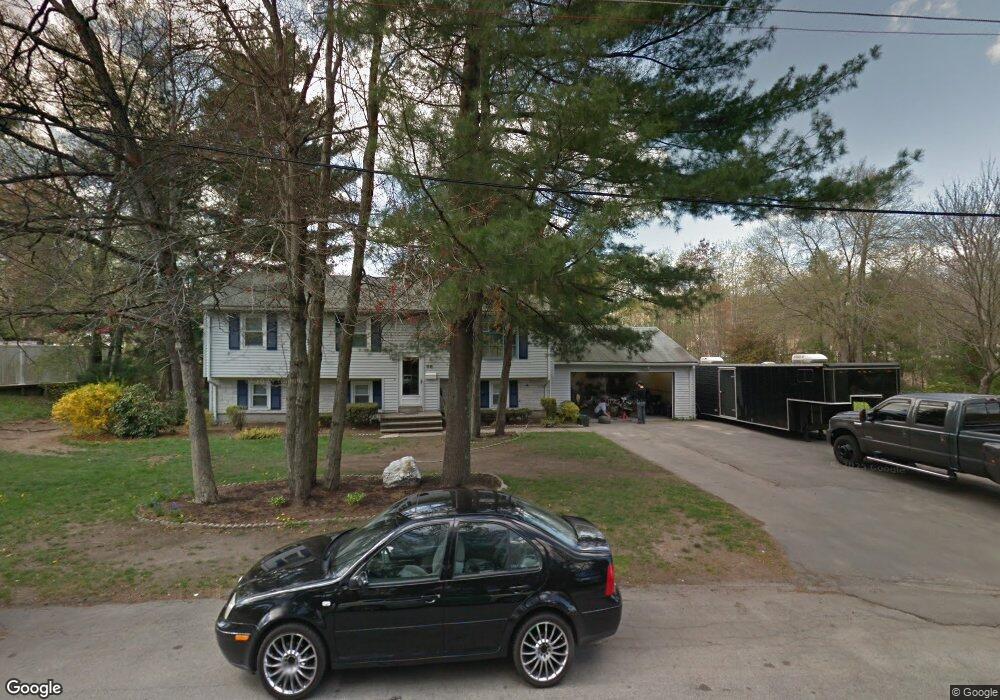
98 Sinclair Rd Brockton, MA 02302
Estimated Value: $537,000 - $591,000
About This Home
This home is located at 98 Sinclair Rd, Brockton, MA 02302 and is currently estimated at $565,249, approximately $494 per square foot. 98 Sinclair Rd is a home located in Plymouth County with nearby schools including Gilmore Elementary School, Davis K-8 School, and John F. Kennedy Elementary School.
Ownership History
We collect this data history from publicly available records. To have your information removed, we recommend requesting removal directly through your county’s website.
Purchase Details
Home Financials for this Owner
Home Financials are based on the most recent Mortgage that was taken out on this home.Purchase Details
Purchase Details
Purchase History
We collect this data history from publicly available records. To have your information removed, we recommend requesting removal directly through your county’s website.
| Date | Buyer | Sale Price | Title Company |
|---|---|---|---|
| -- | None Available | ||
| -- | None Available | ||
| $307,500 | -- | ||
| $307,500 | -- | ||
| $108,000 | -- |
Mortgage History
We collect this data history from publicly available records. To have your information removed, we recommend requesting removal directly through your county’s website.
| Date | Status | Borrower | Loan Amount |
|---|---|---|---|
| Previous Owner | $295,000 | ||
| Previous Owner | $45,000 | ||
| Previous Owner | $239,000 |
Tax History
We collect this data history from publicly available records. To have your information removed, we recommend requesting removal directly through your county’s website.
| Year | Tax Paid | Tax Assessment Tax Assessment Total Assessment is a certain percentage of the fair market value that is determined by local assessors to be the total taxable value of land and additions on the property. | Land | Improvement |
|---|---|---|---|---|
| 2025 | $6,238 | $515,100 | $173,800 | $341,300 |
| 2024 | $5,842 | $486,000 | $173,800 | $312,200 |
| 2023 | $5,671 | $436,900 | $125,900 | $311,000 |
| 2022 | $5,120 | $366,500 | $114,400 | $252,100 |
| 2021 | $70,280 | $338,100 | $103,500 | $234,600 |
| 2020 | $67,927 | $342,800 | $90,200 | $252,600 |
| 2019 | $67,252 | $328,500 | $86,300 | $242,200 |
| 2018 | $4,800 | $298,900 | $86,300 | $212,600 |
| 2017 | $51,755 | $265,200 | $86,300 | $178,900 |
| 2016 | $4,248 | $244,700 | $82,600 | $162,100 |
| 2015 | $4,242 | $233,700 | $82,600 | $151,100 |
| 2014 | $3,967 | $218,800 | $82,600 | $136,200 |
Map
- 359 Plain St
- 23 Dondi Rd
- 575 East St
- 64 Dunbar St
- 780 Summer St
- 55 Coral St
- 549 Summer St
- 63 S Leyden St
- 187 Riverview St
- 9 Longworth Ave Unit 113
- 15 Longworth Ave Unit 226
- 111 Riverview St
- 35 Longworth Ave Unit 25
- 35 Longworth Ave Unit 12
- 16 Liberty St
- 39 Friendship Dr
- 21 Jason Way
- 789 N Main St
- 33 Glendale Ave
- 46 Churchill Ave
Ask me questions while you tour the home.