99 Apple Rd Brimfield, MA 01010
Estimated Value: $524,997 - $569,000
About This Home
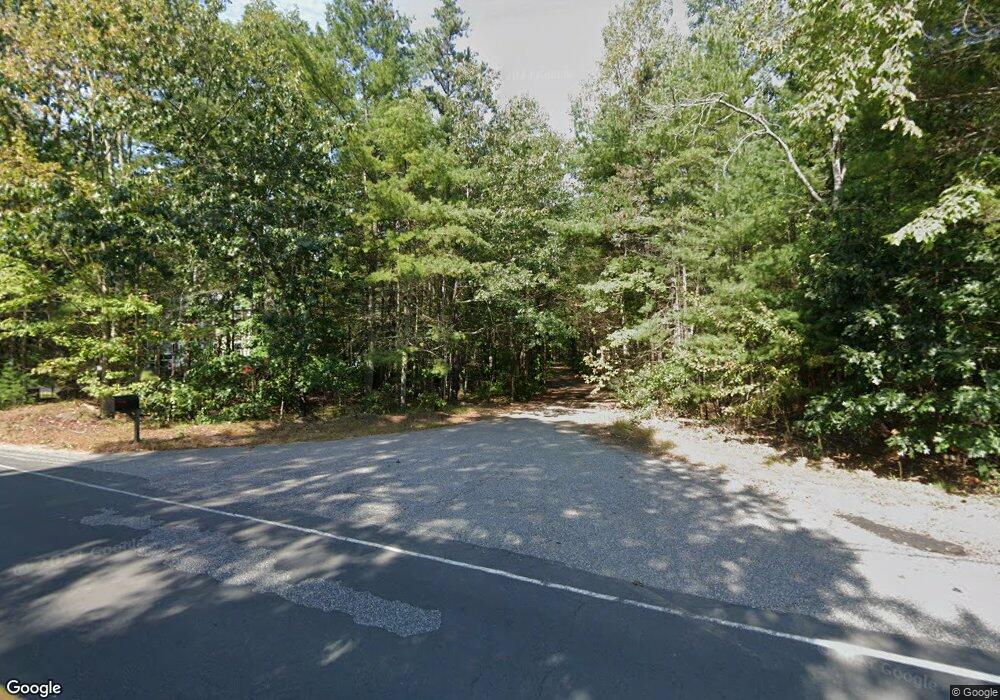
This home is located at 99 Apple Rd, Brimfield, MA 01010 and is currently estimated at $547,499, approximately $205 per square foot. 99 Apple Rd is a home located in Hampden County with nearby schools including Brimfield Elementary School, Tantasqua Regional Junior High School, and Tantasqua Regional High School.
Ownership History
We collect this data history from publicly available records. To have your information removed, we recommend requesting removal directly through your county’s website.
Purchase Details
Purchase Details
Home Values in the Area
Average Home Value in this Area
Purchase History
We collect this data history from publicly available records. To have your information removed, we recommend requesting removal directly through your county’s website.
| Date | Buyer | Sale Price | Title Company |
|---|---|---|---|
| -- | None Available | ||
| -- | None Available | ||
| $105,000 | -- | ||
| $105,000 | -- |
Mortgage History
We collect this data history from publicly available records. To have your information removed, we recommend requesting removal directly through your county’s website.
| Date | Status | Borrower | Loan Amount |
|---|---|---|---|
| Previous Owner | $42,000 | ||
| Previous Owner | $90,800 | ||
| Previous Owner | $20,000 |
Tax History
We collect this data history from publicly available records. To have your information removed, we recommend requesting removal directly through your county’s website.
| Year | Tax Paid | Tax Assessment Tax Assessment Total Assessment is a certain percentage of the fair market value that is determined by local assessors to be the total taxable value of land and additions on the property. | Land | Improvement |
|---|---|---|---|---|
| 2025 | $5,143 | $363,700 | $69,200 | $294,500 |
| 2024 | $4,988 | $341,200 | $65,300 | $275,900 |
| 2023 | $4,844 | $318,500 | $65,300 | $253,200 |
| 2022 | $4,497 | $273,700 | $60,800 | $212,900 |
| 2021 | $4,363 | $248,600 | $60,800 | $187,800 |
| 2020 | $4,174 | $236,200 | $60,800 | $175,400 |
| 2019 | $3,926 | $220,800 | $60,800 | $160,000 |
| 2018 | $3,776 | $220,800 | $60,800 | $160,000 |
| 2017 | $3,676 | $220,800 | $60,800 | $160,000 |
| 2016 | $3,706 | $214,700 | $57,900 | $156,800 |
| 2015 | $3,605 | $214,700 | $57,900 | $156,800 |
| 2014 | $3,525 | $214,700 | $57,900 | $156,800 |
Map
- 97 Apple Rd
- 285 Brookfield Rd
- 16 Governor Fairbanks Rd
- 140 Paradise Ln
- 16 Schoolhouse Cross Rd
- 0 Brookfield Rd
- 299 Clark Road Extension
- 79 7th St
- 3 Devils Ln
- 50 Little Rest Rd
- 30 Little Rest Rd
- 174 Cedar St
- 20 Deer Run
- 692 Cronin Rd
- 21 Fox Run
- 621 Main St
- 16 Summit Ave
- 26 Woodside Cir
- 893 Cronin Rd
- 7 Crescent Way Unit 302
Ask me questions while you tour the home.