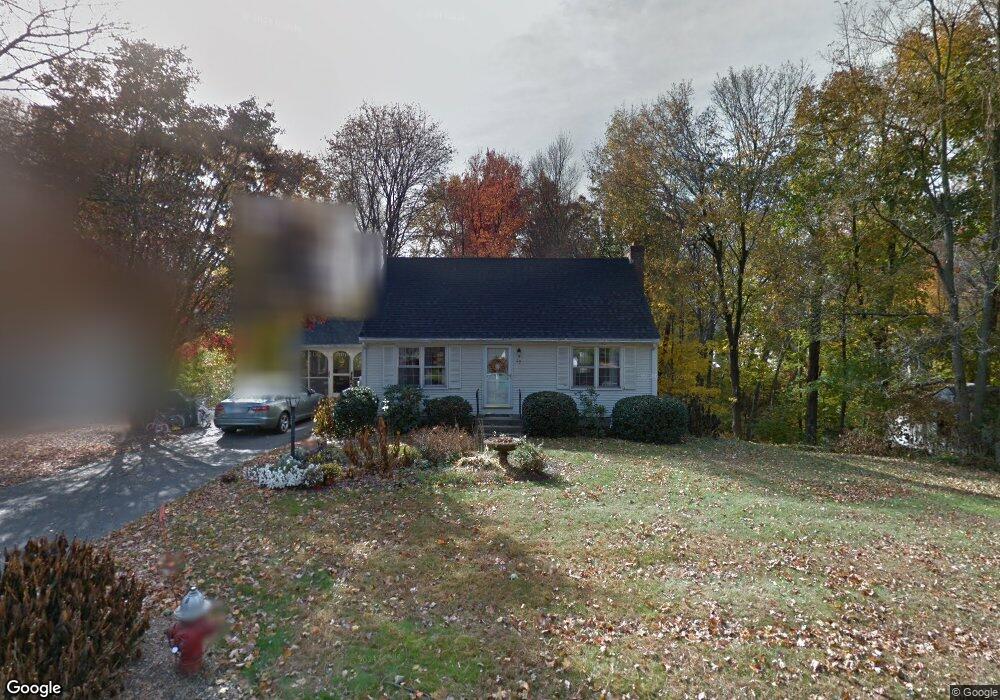
99 Berwick Rd Longmeadow, MA 01106
Estimated Value: $320,000 - $398,000
3
Beds
2
Baths
1,376
Sq Ft
$271/Sq Ft
Est. Value
About This Home
This home is located at 99 Berwick Rd, Longmeadow, MA 01106 and is currently estimated at $373,365, approximately $271 per square foot. 99 Berwick Rd is a home located in Hampden County with nearby schools including Wolf Swamp Road School, Glenbrook Middle School, and Longmeadow High School.
Ownership History
Date
Name
Owned For
Owner Type
Purchase Details
Closed on
Sep 29, 2025
Sold by
Connor Kevin
Bought by
Shapiro Olivia
Current Estimated Value
Home Financials for this Owner
Home Financials are based on the most recent Mortgage that was taken out on this home.
Original Mortgage
$245,000
Outstanding Balance
$243,516
Interest Rate
5%
Mortgage Type
New Conventional
Estimated Equity
$129,849
Purchase Details
Closed on
Dec 5, 2023
Sold by
Fitzgerald June C
Bought by
Connor Kevin J
Create a Home Valuation Report for This Property
The Home Valuation Report is an in-depth analysis detailing your home's value as well as a comparison with similar homes in the area
Home Values in the Area
Average Home Value in this Area
Purchase History
| Date | Buyer | Sale Price | Title Company |
|---|---|---|---|
| Shapiro Olivia | $310,000 | -- | |
| Connor Kevin J | $225,000 | None Available |
Source: Public Records
Mortgage History
| Date | Status | Borrower | Loan Amount |
|---|---|---|---|
| Open | Shapiro Olivia | $245,000 |
Source: Public Records
Tax History
| Year | Tax Paid | Tax Assessment Tax Assessment Total Assessment is a certain percentage of the fair market value that is determined by local assessors to be the total taxable value of land and additions on the property. | Land | Improvement |
|---|---|---|---|---|
| 2025 | $6,450 | $305,400 | $145,400 | $160,000 |
| 2024 | $6,742 | $326,000 | $145,400 | $180,600 |
| 2023 | $6,450 | $281,400 | $117,200 | $164,200 |
| 2022 | $6,148 | $249,500 | $117,200 | $132,300 |
| 2021 | $6,034 | $243,900 | $118,500 | $125,400 |
| 2020 | $5,568 | $230,000 | $111,600 | $118,400 |
| 2019 | $1,008 | $218,900 | $111,600 | $107,300 |
| 2018 | $5,131 | $210,800 | $130,500 | $80,300 |
| 2017 | $4,971 | $210,800 | $130,500 | $80,300 |
| 2016 | $4,878 | $200,500 | $123,400 | $77,100 |
| 2015 | $4,707 | $199,300 | $122,200 | $77,100 |
Source: Public Records
Map
Nearby Homes
- 141 Lincoln Rd
- 79 Roosevelt Blvd
- 357 Maple Rd
- 59 Brookside Village Unit 59
- 0 Mill Rd
- 24 Herbert St
- 3 Magnolia Dr
- 68 Hazardville Rd
- 27 Massachusetts Ave
- 27 Booth St
- Lot 114 Bark Haul Rd
- 70 Tennyson Dr
- 64 Brookwood Dr
- 449 The Meadows
- 0 Dennis Rd
- 31 Sharren Ln
- 53 Meadowlark Dr
- 63 Meadowlark Dr
- 2 Sharren Ln
- 56 Liberty Ln
Your Personal Tour Guide
Ask me questions while you tour the home.