Estimated Value: $850,122 - $910,000
4
Beds
3
Baths
2,286
Sq Ft
$386/Sq Ft
Est. Value
About This Home
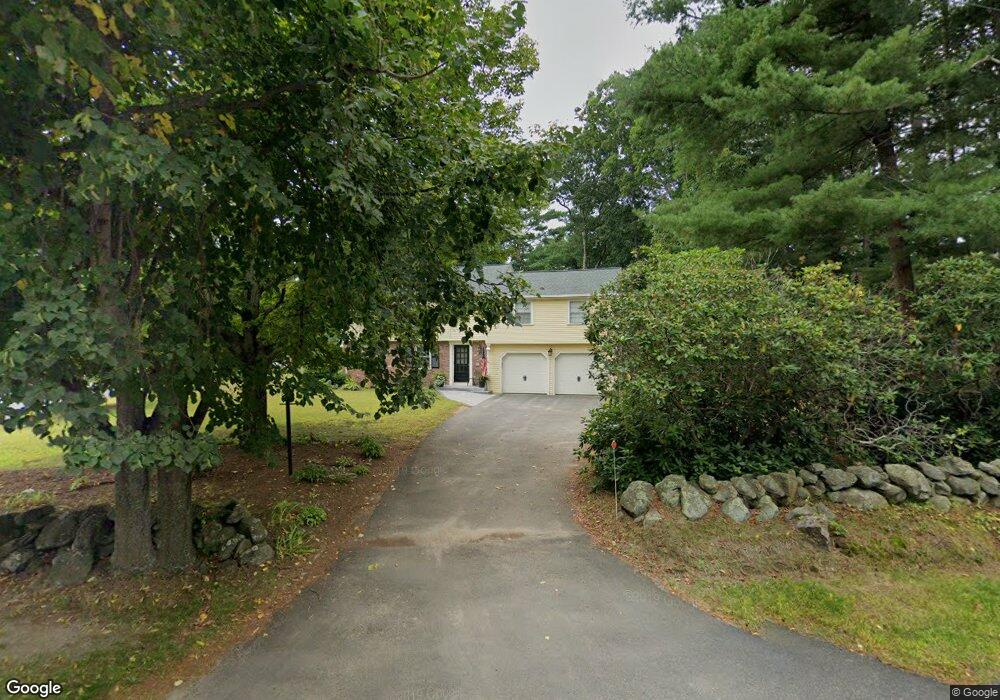
This home is located at 99 Concord Rd, Acton, MA 01720 and is currently estimated at $881,531, approximately $385 per square foot. 99 Concord Rd is a home located in Middlesex County with nearby schools including Acton-Boxborough Regional High School and Nashoba Brooks School.
Ownership History
Date
Name
Owned For
Owner Type
Purchase Details
Closed on
Sep 1, 2010
Sold by
R E Regan T 1 and Regan Ruth E
Bought by
Crowley John P and Crowley Elizabeth Ahern
Current Estimated Value
Home Financials for this Owner
Home Financials are based on the most recent Mortgage that was taken out on this home.
Original Mortgage
$375,000
Outstanding Balance
$249,003
Interest Rate
4.55%
Mortgage Type
Purchase Money Mortgage
Estimated Equity
$632,528
Create a Home Valuation Report for This Property
The Home Valuation Report is an in-depth analysis detailing your home's value as well as a comparison with similar homes in the area
Home Values in the Area
Average Home Value in this Area
Purchase History
| Date | Buyer | Sale Price | Title Company |
|---|---|---|---|
| Crowley John P | $490,000 | -- |
Source: Public Records
Mortgage History
| Date | Status | Borrower | Loan Amount |
|---|---|---|---|
| Open | Crowley John P | $375,000 |
Source: Public Records
Tax History
| Year | Tax Paid | Tax Assessment Tax Assessment Total Assessment is a certain percentage of the fair market value that is determined by local assessors to be the total taxable value of land and additions on the property. | Land | Improvement |
|---|---|---|---|---|
| 2025 | $13,008 | $758,500 | $325,200 | $433,300 |
| 2024 | $12,184 | $730,900 | $325,200 | $405,700 |
| 2023 | $11,867 | $675,800 | $295,500 | $380,300 |
| 2022 | $11,236 | $577,700 | $256,800 | $320,900 |
| 2021 | $10,963 | $541,900 | $237,900 | $304,000 |
| 2020 | $9,912 | $515,200 | $237,900 | $277,300 |
| 2019 | $9,648 | $498,100 | $237,900 | $260,200 |
| 2018 | $9,494 | $489,900 | $237,900 | $252,000 |
| 2017 | $9,259 | $485,800 | $237,900 | $247,900 |
| 2016 | $9,105 | $473,500 | $237,900 | $235,600 |
| 2015 | $9,384 | $492,600 | $237,900 | $254,700 |
| 2014 | $9,099 | $467,800 | $237,900 | $229,900 |
Source: Public Records
Map
Nearby Homes
Your Personal Tour Guide
Ask me questions while you tour the home.