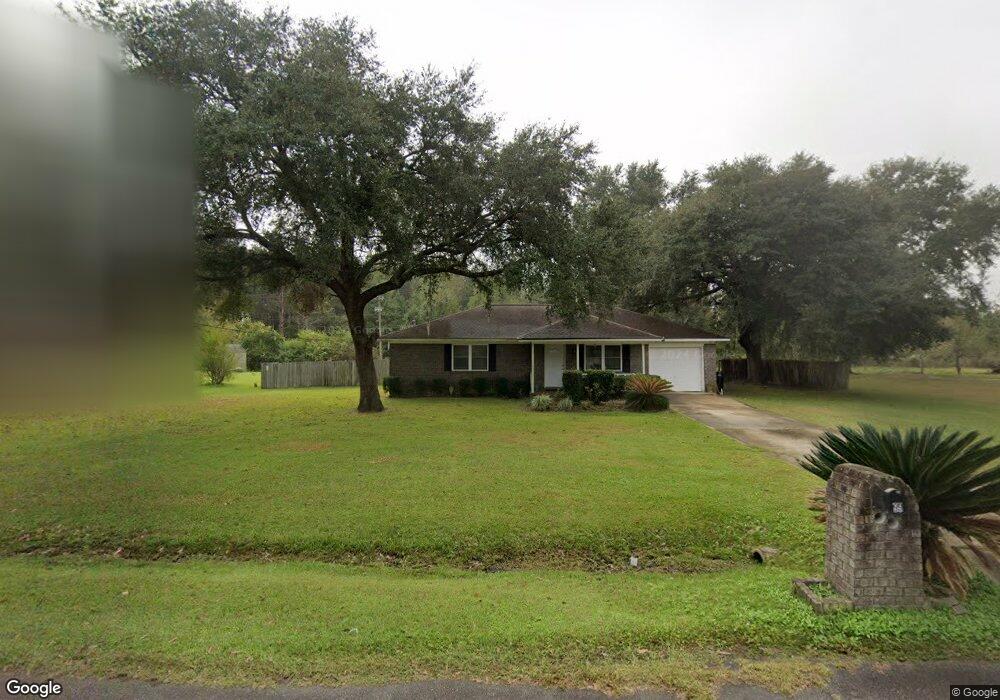
99 E Red Fox Ct Midway, GA 31320
Estimated Value: $168,000 - $250,000
3
Beds
2
Baths
1,092
Sq Ft
$190/Sq Ft
Est. Value
About This Home
This home is located at 99 E Red Fox Ct, Midway, GA 31320 and is currently estimated at $206,983, approximately $189 per square foot. 99 E Red Fox Ct is a home located in Liberty County with nearby schools including Liberty Elementary School, Midway Middle School, and Liberty County High School.
Ownership History
Date
Name
Owned For
Owner Type
Purchase Details
Closed on
Aug 16, 2017
Sold by
Dailey Anna M
Bought by
Fruge Richard
Current Estimated Value
Purchase Details
Closed on
Mar 11, 1999
Sold by
Wolkens James C
Bought by
Gillis Anna M
Purchase Details
Closed on
Dec 18, 1995
Sold by
Holland Homes
Bought by
Wolkens Ii James C and Wolkens Samantha
Purchase Details
Closed on
Nov 7, 1995
Sold by
Dykes Lenard
Bought by
Holland Homes
Purchase Details
Closed on
Jun 13, 1994
Bought by
Dykes Lenard
Create a Home Valuation Report for This Property
The Home Valuation Report is an in-depth analysis detailing your home's value as well as a comparison with similar homes in the area
Purchase History
| Date | Buyer | Sale Price | Title Company |
|---|---|---|---|
| Fruge Richard | $102,000 | -- | |
| Gillis Anna M | $69,500 | -- | |
| Wolkens Ii James C | $65,200 | -- | |
| Holland Homes | $10,500 | -- | |
| Dykes Lenard | -- | -- |
Source: Public Records
Tax History
| Year | Tax Paid | Tax Assessment Tax Assessment Total Assessment is a certain percentage of the fair market value that is determined by local assessors to be the total taxable value of land and additions on the property. | Land | Improvement |
|---|---|---|---|---|
| 2025 | $788 | $68,001 | $20,000 | $48,001 |
| 2024 | $891 | $65,218 | $14,000 | $51,218 |
| 2023 | $756 | $57,206 | $12,000 | $45,206 |
| 2022 | $713 | $44,406 | $10,800 | $33,606 |
| 2021 | $661 | $41,126 | $10,800 | $30,326 |
| 2020 | $641 | $41,474 | $10,800 | $30,674 |
| 2019 | $590 | $37,920 | $10,000 | $27,920 |
| 2018 | $555 | $38,234 | $10,000 | $28,234 |
| 2017 | $1,431 | $33,724 | $8,000 | $25,724 |
Source: Public Records
Map
Nearby Homes
- 12 E Red Fox Ct
- 35 W Red Fox Ct
- 48 W Beaver Ln
- 146 River Bend Dr
- 327 River Bend Dr
- 0 E Oglethorpe Unit SA341930
- 0 E Oglethorpe Unit 153327
- 0 E Oglethorpe Unit 10592168
- 0 E Oglethorpe Unit SA350017
- 0 E Oglethorpe Unit SA350025
- 29 Arlen Dr
- 8701 E Oglethorpe Hwy
- 46 Delaney Ct
- 260 Arlen Dr
- 0000 E Oglethorpe Hwy
- 182 Gloucester Dr
- 0 S Coastal Hwy
- 135 Kettle Creek Ln
- 29 Sassafras Ln
- 1.56 AC S Coastal Hwy
- 77 E Red Fox Ct
- 127 E Red Fox Ct
- 100 E Red Fox Ct
- 78 E Red Fox Ct
- 55 E Red Fox Ct
- 128 E Red Fox Ct
- 143 E Red Fox Ct
- 56 E Red Fox Ct
- 144 E Red Fox Ct
- 81 E Beaver Ln
- 33 E Red Fox Ct
- 19 Cross Creek Dr
- 34 E Red Fox Ct
- 55 E Beaver Ln
- 93 E Beaver Ln
- 71 Edgewater Dr
- 93 Edgewater Dr
- 11 E Red Fox Ct
- 33 E Beaver Ln
- 113 Edgewater Dr
Your Personal Tour Guide
Ask me questions while you tour the home.