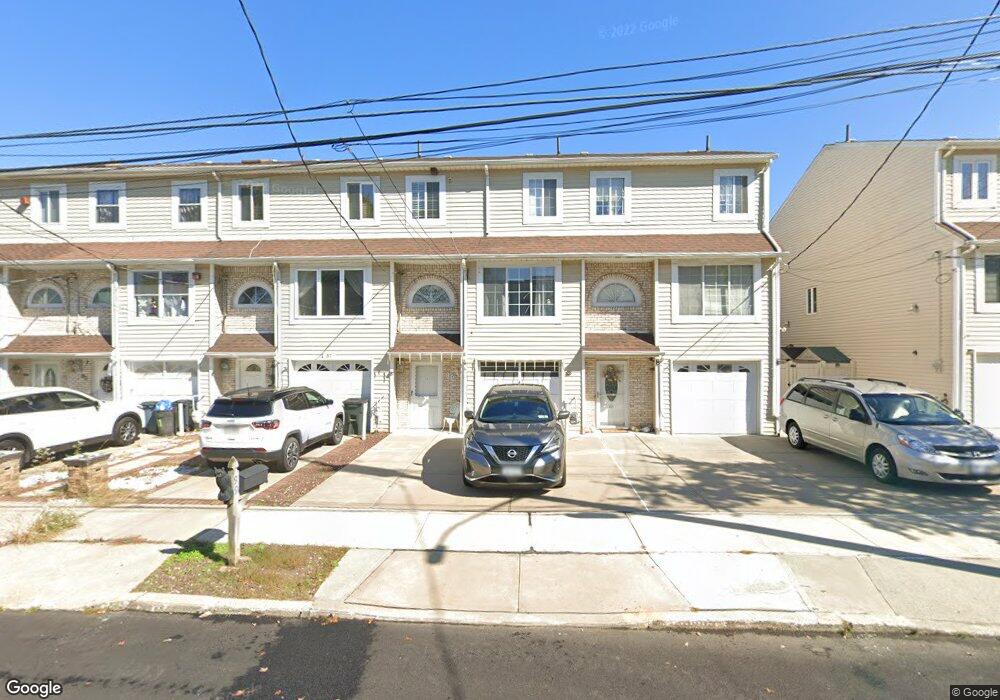
99 Eagan Ave Staten Island, NY 10312
Annadale NeighborhoodEstimated Value: $622,102 - $721,000
3
Beds
3
Baths
1,854
Sq Ft
$363/Sq Ft
Est. Value
About This Home
This home is located at 99 Eagan Ave, Staten Island, NY 10312 and is currently estimated at $673,776, approximately $363 per square foot. 99 Eagan Ave is a home located in Richmond County with nearby schools including P.S. 55 The Henry M. Boehm School, I.S. 007 Elias Bernstein, and Tottenville High School.
Ownership History
Date
Name
Owned For
Owner Type
Purchase Details
Closed on
Dec 19, 2011
Sold by
Cecora Frank and Cecora Diane
Bought by
Mart Anna and Mart Aleksandr
Current Estimated Value
Home Financials for this Owner
Home Financials are based on the most recent Mortgage that was taken out on this home.
Original Mortgage
$270,400
Outstanding Balance
$184,883
Interest Rate
4%
Mortgage Type
New Conventional
Estimated Equity
$488,893
Create a Home Valuation Report for This Property
The Home Valuation Report is an in-depth analysis detailing your home's value as well as a comparison with similar homes in the area
Home Values in the Area
Average Home Value in this Area
Purchase History
| Date | Buyer | Sale Price | Title Company |
|---|---|---|---|
| Mart Anna | $338,000 | Access Title Ins Agency Inc |
Source: Public Records
Mortgage History
| Date | Status | Borrower | Loan Amount |
|---|---|---|---|
| Open | Mart Anna | $270,400 |
Source: Public Records
Tax History
| Year | Tax Paid | Tax Assessment Tax Assessment Total Assessment is a certain percentage of the fair market value that is determined by local assessors to be the total taxable value of land and additions on the property. | Land | Improvement |
|---|---|---|---|---|
| 2025 | $6,046 | $32,040 | $6,878 | $25,162 |
| 2024 | $6,058 | $31,500 | $6,661 | $24,839 |
| 2023 | $5,807 | $29,993 | $5,400 | $24,593 |
| 2022 | $5,362 | $32,700 | $6,600 | $26,100 |
| 2021 | $5,652 | $31,740 | $6,600 | $25,140 |
| 2020 | $5,648 | $30,180 | $6,600 | $23,580 |
| 2019 | $5,249 | $30,060 | $6,600 | $23,460 |
| 2018 | $4,797 | $24,994 | $6,349 | $18,645 |
| 2017 | $4,507 | $23,580 | $6,600 | $16,980 |
| 2016 | $4,488 | $24,000 | $6,600 | $17,400 |
| 2015 | $4,222 | $25,003 | $5,981 | $19,022 |
| 2014 | $4,222 | $23,589 | $5,643 | $17,946 |
Source: Public Records
Map
Nearby Homes
Your Personal Tour Guide
Ask me questions while you tour the home.