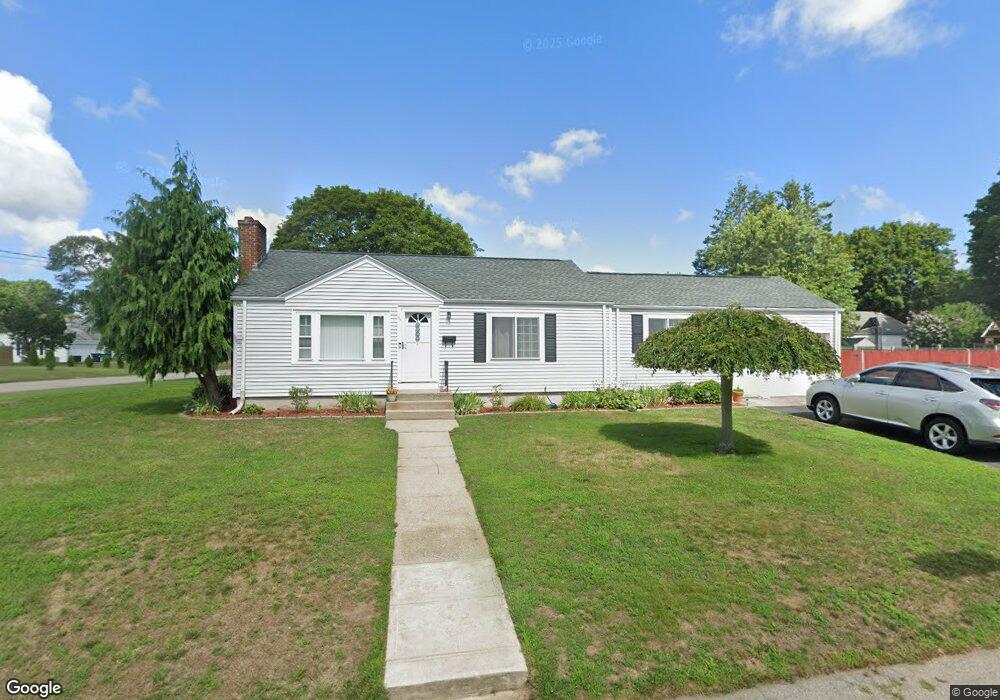
99 Galant Dr Warwick, RI 02886
Greenwood NeighborhoodEstimated Value: $398,797 - $438,000
3
Beds
1
Bath
1,240
Sq Ft
$332/Sq Ft
Est. Value
About This Home
This home is located at 99 Galant Dr, Warwick, RI 02886 and is currently estimated at $411,949, approximately $332 per square foot. 99 Galant Dr is a home located in Kent County with nearby schools including St Rose Of Lima School.
Ownership History
Date
Name
Owned For
Owner Type
Purchase Details
Closed on
Mar 18, 2015
Sold by
Cabral Mario
Bought by
Cabral Mario and Cabral Maria E
Current Estimated Value
Purchase Details
Closed on
Jan 27, 1998
Sold by
Elliott John R and Elliott Carol
Bought by
Cabral Mario
Home Financials for this Owner
Home Financials are based on the most recent Mortgage that was taken out on this home.
Original Mortgage
$78,937
Interest Rate
7.11%
Mortgage Type
Purchase Money Mortgage
Create a Home Valuation Report for This Property
The Home Valuation Report is an in-depth analysis detailing your home's value as well as a comparison with similar homes in the area
Home Values in the Area
Average Home Value in this Area
Purchase History
| Date | Buyer | Sale Price | Title Company |
|---|---|---|---|
| Cabral Mario | -- | -- | |
| Cabral Mario | $79,000 | -- |
Source: Public Records
Mortgage History
| Date | Status | Borrower | Loan Amount |
|---|---|---|---|
| Previous Owner | Cabral Mario | $70,491 | |
| Previous Owner | Cabral Mario | $78,937 |
Source: Public Records
Tax History
| Year | Tax Paid | Tax Assessment Tax Assessment Total Assessment is a certain percentage of the fair market value that is determined by local assessors to be the total taxable value of land and additions on the property. | Land | Improvement |
|---|---|---|---|---|
| 2025 | $4,475 | $352,400 | $108,800 | $243,600 |
| 2024 | $4,296 | $296,900 | $89,800 | $207,100 |
| 2023 | $4,213 | $296,900 | $89,800 | $207,100 |
| 2022 | $4,072 | $217,400 | $64,700 | $152,700 |
| 2021 | $4,072 | $217,400 | $64,700 | $152,700 |
| 2020 | $4,072 | $217,400 | $64,700 | $152,700 |
| 2019 | $4,072 | $217,400 | $64,700 | $152,700 |
| 2018 | $3,546 | $170,500 | $63,700 | $106,800 |
| 2017 | $3,451 | $170,500 | $63,700 | $106,800 |
| 2016 | $3,451 | $170,500 | $63,700 | $106,800 |
| 2015 | $3,266 | $157,400 | $61,100 | $96,300 |
| 2014 | $3,157 | $157,400 | $61,100 | $96,300 |
| 2013 | $3,115 | $157,400 | $61,100 | $96,300 |
Source: Public Records
Map
Nearby Homes
- 46 Galant Dr
- 652 Main Ave
- 24 Johnson Ave
- 74 Stephens Ave
- 157 George Arden Ave
- 66 Scenic Dr
- 66 Child Ln
- 130 Brentwood Ave
- 88 Child Ln
- 51 Red Maple Ln
- 15 Link St
- 16 Arrow Ave
- 543 Quisset Ct
- 28 Myrtle Ave
- 0 Larkin Ave
- 2907 Post Rd Unit 2
- 2907 Post Rd Unit 3
- 2907 Post Rd Unit 5
- 2907 Post Rd Unit 7
- 2907 Post Rd Unit 1
Your Personal Tour Guide
Ask me questions while you tour the home.