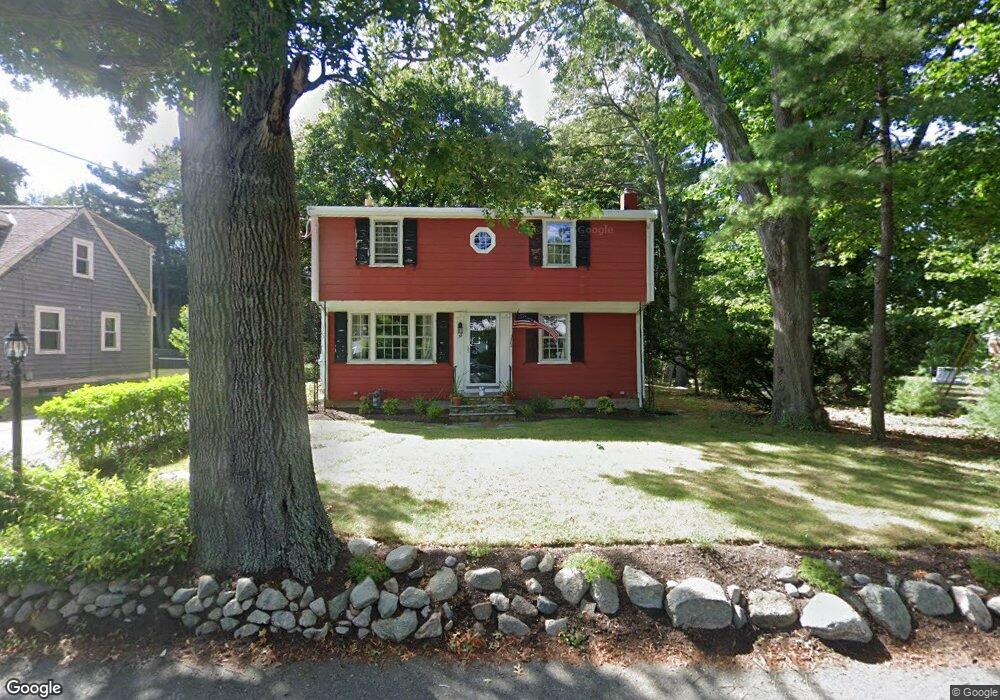
99 High St Norwell, MA 02061
Norwell AreaEstimated Value: $563,000 - $658,968
3
Beds
1
Bath
1,322
Sq Ft
$453/Sq Ft
Est. Value
About This Home
This home is located at 99 High St, Norwell, MA 02061 and is currently estimated at $598,242, approximately $452 per square foot. 99 High St is a home located in Plymouth County with nearby schools including Grace Farrar Cole Elementary School, Norwell Middle School, and Norwell High School.
Create a Home Valuation Report for This Property
The Home Valuation Report is an in-depth analysis detailing your home's value as well as a comparison with similar homes in the area
Home Values in the Area
Average Home Value in this Area
Tax History
We collect this data history from publicly available records. To have your information removed, we recommend requesting removal directly through your county’s website.
| Year | Tax Paid | Tax Assessment Tax Assessment Total Assessment is a certain percentage of the fair market value that is determined by local assessors to be the total taxable value of land and additions on the property. | Land | Improvement |
|---|---|---|---|---|
| 2025 | $7,032 | $538,000 | $299,000 | $239,000 |
| 2024 | $6,970 | $517,800 | $297,800 | $220,000 |
| 2023 | $6,792 | $444,200 | $265,200 | $179,000 |
| 2022 | $6,101 | $367,100 | $209,600 | $157,500 |
| 2021 | $6,042 | $356,700 | $220,700 | $136,000 |
| 2020 | $5,842 | $351,300 | $220,700 | $130,600 |
| 2019 | $5,546 | $338,200 | $216,200 | $122,000 |
| 2018 | $5,011 | $306,700 | $200,600 | $106,100 |
| 2017 | $5,190 | $315,500 | $200,600 | $114,900 |
| 2016 | $5,094 | $308,700 | $200,600 | $108,100 |
| 2015 | $4,818 | $292,000 | $196,900 | $95,100 |
| 2014 | $4,701 | $287,200 | $186,500 | $100,700 |
Source: Public Records
Map
Nearby Homes
- 165 High St
- 165-B High St
- 214 Washington St Unit 28
- 177 High St
- 179 High St
- 239 Washington St Unit 18
- 5 Blueberry Ct
- 136 Pond St
- 16 Holly Ct
- 198 Pond St
- 76 Gardner St
- 1154 Main St
- 72 Beckford Farm Rd
- 371 Gardner St
- 42 Bard Rock Ln
- 25 Buffum Rd
- 22 Harvest Ln
- 120 Deerfield Ln
- 295 Gardner St
- 7 Judith St
Your Personal Tour Guide
Ask me questions while you tour the home.