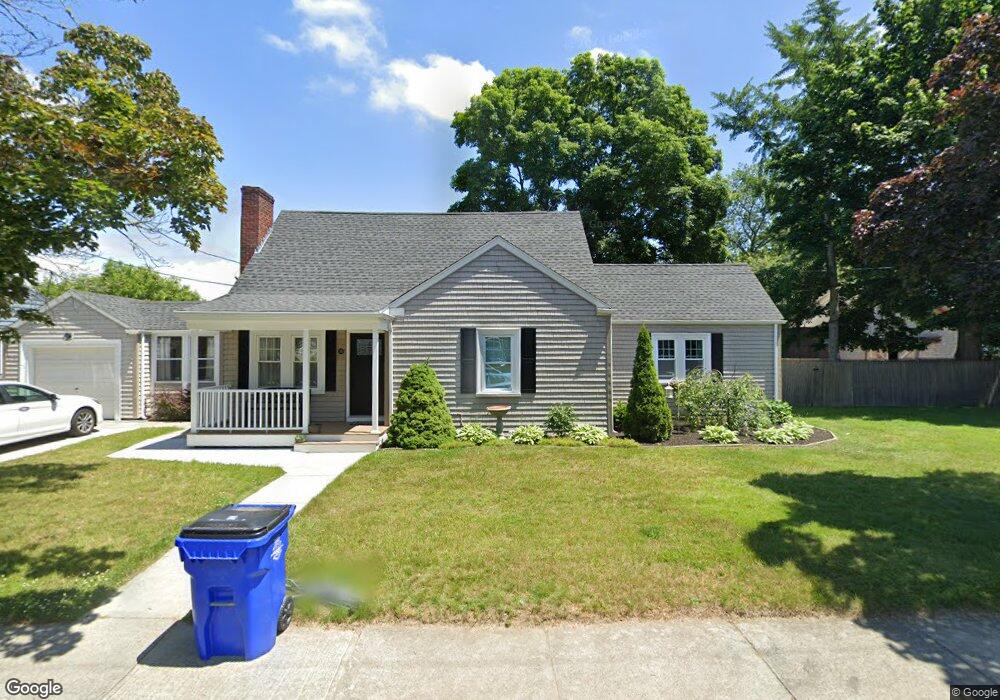
99 Moore St Fall River, MA 02720
Highlands-Fall River NeighborhoodEstimated Value: $429,000 - $474,000
4
Beds
1
Bath
1,524
Sq Ft
$293/Sq Ft
Est. Value
About This Home
This home is located at 99 Moore St, Fall River, MA 02720 and is currently estimated at $447,116, approximately $293 per square foot. 99 Moore St is a home located in Bristol County with nearby schools including Spencer Borden Elementary School, Morton Middle School, and B M C Durfee High School.
Ownership History
Date
Name
Owned For
Owner Type
Purchase Details
Closed on
Sep 21, 2011
Sold by
Timberlake Mary E and Timberlake Brian D
Bought by
Martel Thomas R and Martel Lina B
Current Estimated Value
Home Financials for this Owner
Home Financials are based on the most recent Mortgage that was taken out on this home.
Original Mortgage
$140,000
Outstanding Balance
$96,191
Interest Rate
4.33%
Mortgage Type
Purchase Money Mortgage
Estimated Equity
$350,925
Create a Home Valuation Report for This Property
The Home Valuation Report is an in-depth analysis detailing your home's value as well as a comparison with similar homes in the area
Home Values in the Area
Average Home Value in this Area
Purchase History
| Date | Buyer | Sale Price | Title Company |
|---|---|---|---|
| Martel Thomas R | $175,000 | -- |
Source: Public Records
Mortgage History
| Date | Status | Borrower | Loan Amount |
|---|---|---|---|
| Open | Martel Thomas R | $11,300 | |
| Open | Martel Thomas R | $140,000 |
Source: Public Records
Tax History
| Year | Tax Paid | Tax Assessment Tax Assessment Total Assessment is a certain percentage of the fair market value that is determined by local assessors to be the total taxable value of land and additions on the property. | Land | Improvement |
|---|---|---|---|---|
| 2025 | $4,289 | $374,600 | $144,100 | $230,500 |
| 2024 | $4,067 | $354,000 | $138,500 | $215,500 |
| 2023 | $4,071 | $331,800 | $124,400 | $207,400 |
| 2022 | $3,655 | $289,600 | $115,100 | $174,500 |
| 2021 | $3,679 | $266,000 | $108,700 | $157,300 |
| 2020 | $3,469 | $240,100 | $104,700 | $135,400 |
| 2019 | $3,437 | $235,700 | $104,700 | $131,000 |
| 2018 | $3,402 | $232,700 | $104,700 | $128,000 |
| 2017 | $3,227 | $230,500 | $104,700 | $125,800 |
| 2016 | $3,057 | $224,300 | $104,700 | $119,600 |
| 2015 | $2,846 | $217,600 | $97,900 | $119,700 |
| 2014 | $2,737 | $217,600 | $97,900 | $119,700 |
Source: Public Records
Map
Nearby Homes
- 295 Newbury St
- 742 New Boston Rd
- 60 Wingold St
- 108 Garden St
- 585 N Eastern Ave
- 964 Pearce St
- 168 Windsor St
- 1079 Langley St
- 45 Read St
- 27 Kane St
- 1231 Robeson St
- 243 Oak Grove Ave
- 301 Madison St
- 445 Madison St
- 44 Bigelow St
- 411 Stewart St
- 499 Hanover St
- 545 Robeson St
- 247 Albany St
- 230 College Park Rd
Your Personal Tour Guide
Ask me questions while you tour the home.