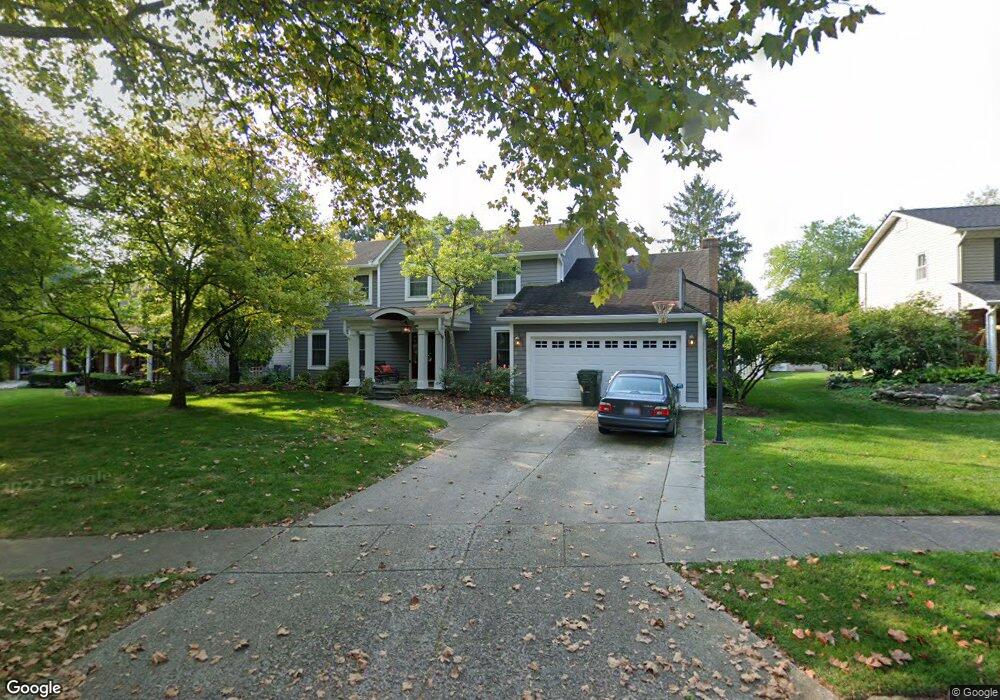
991 Macgregor Ave Columbus, OH 43085
Olentangy Highlands NeighborhoodEstimated Value: $546,000 - $604,000
4
Beds
3
Baths
2,753
Sq Ft
$210/Sq Ft
Est. Value
About This Home
This home is located at 991 Macgregor Ave, Columbus, OH 43085 and is currently estimated at $578,912, approximately $210 per square foot. 991 Macgregor Ave is a home located in Franklin County with nearby schools including Evening Street Elementary School, Kilbourne Middle School, and Thomas Worthington High School.
Ownership History
Date
Name
Owned For
Owner Type
Purchase Details
Closed on
Jul 4, 1999
Sold by
Raju Venugopal and Venugopal Sonia T
Bought by
Johnson Kevin L and Johnson Christine L
Current Estimated Value
Home Financials for this Owner
Home Financials are based on the most recent Mortgage that was taken out on this home.
Original Mortgage
$195,700
Interest Rate
7.78%
Mortgage Type
Purchase Money Mortgage
Purchase Details
Closed on
Feb 3, 1992
Bought by
Venugopal Raju and Venugopal Sonia R
Purchase Details
Closed on
Aug 31, 1987
Purchase Details
Closed on
May 1, 1983
Create a Home Valuation Report for This Property
The Home Valuation Report is an in-depth analysis detailing your home's value as well as a comparison with similar homes in the area
Home Values in the Area
Average Home Value in this Area
Purchase History
| Date | Buyer | Sale Price | Title Company |
|---|---|---|---|
| Johnson Kevin L | $206,000 | Lender'S Service Inc | |
| Venugopal Raju | $170,000 | -- | |
| -- | $168,500 | -- | |
| -- | $137,500 | -- |
Source: Public Records
Mortgage History
| Date | Status | Borrower | Loan Amount |
|---|---|---|---|
| Previous Owner | Johnson Kevin L | $195,700 |
Source: Public Records
Tax History
| Year | Tax Paid | Tax Assessment Tax Assessment Total Assessment is a certain percentage of the fair market value that is determined by local assessors to be the total taxable value of land and additions on the property. | Land | Improvement |
|---|---|---|---|---|
| 2025 | $9,939 | $161,880 | $42,460 | $119,420 |
| 2024 | $9,939 | $161,880 | $42,460 | $119,420 |
| 2023 | $9,504 | $161,875 | $42,455 | $119,420 |
| 2022 | $9,660 | $130,560 | $26,360 | $104,200 |
| 2021 | $8,912 | $130,560 | $26,360 | $104,200 |
| 2020 | $8,584 | $130,560 | $26,360 | $104,200 |
| 2019 | $8,248 | $113,200 | $22,930 | $90,270 |
| 2018 | $7,416 | $113,200 | $22,930 | $90,270 |
| 2017 | $7,391 | $113,200 | $22,930 | $90,270 |
| 2016 | $6,841 | $96,360 | $20,900 | $75,460 |
| 2015 | $6,842 | $96,360 | $20,900 | $75,460 |
| 2014 | $6,840 | $96,360 | $20,900 | $75,460 |
| 2013 | $3,094 | $87,605 | $19,005 | $68,600 |
Source: Public Records
Map
Nearby Homes
- 941 Robbins Way
- 7044 Linworth Rd
- 1354 Lorine Place
- 7164 Durness Place
- 6577 Plesenton Dr S
- 1159 Tessier Dr
- 1041 Bluffway Dr
- 902-904 Bluffway Dr
- 6829 Merwood St
- 6637 Merwin Rd
- 236 Weydon Rd
- 115 Saint Andre St Unit 9D
- 203 Saint Pierre St Unit 4-C
- 120 Saint Julien St Unit 36C
- 1576 Fallhaven Dr
- 742 Gatehouse Ln
- 877 Northbridge Ln
- 7155 Asheville Park Dr
- 7682 Traphill Ct
- 880 Lynbrook Rd
- 6875 Kilt Ct
- 999 Macgregor Ave
- 990 Clan Ct
- 6869 Kilt Ct
- 980 Clan Ct
- 1002 Clan Ct
- 992 Macgregor Ave
- 980 Macgregor Ave
- 1000 Macgregor Ave
- 6872 Kilt Ct
- 972 Clan Ct
- 6861 Kilt Ct
- 1015 Macgregor Ave
- 968 Macgregor Ave
- 1014 Macgregor Ave
- 960 Clan Ct
- 6879 Glade St
- 1005 Clan Ct
- 995 Kelvin Ct
- 955 Macgregor Ave
Your Personal Tour Guide
Ask me questions while you tour the home.