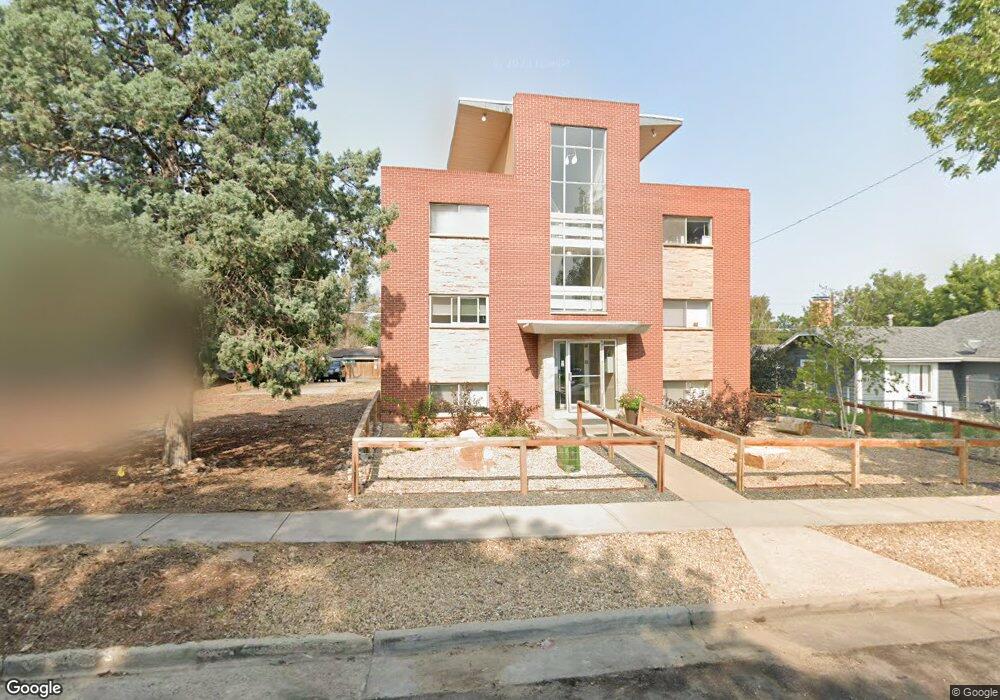
1643 Clinton St Aurora, CO 80010
North Aurora NeighborhoodAbout This Home
WELCOME HOME to Clinton Place, located in Aurora, CO. We are conveniently located off Clinton St. between E. 16th Ave. & E. 17th Ave., giving you easy access to Downtown Denver, DIA, historic downtown Aurora and Anschutz Medical Campus. It gets better- the airy warehouse hangout better known as Stanley Marketplace is less than a mile away! With a community of 50+ locally owned Colorado businesses including restaurants, breweries and shops, a day full of entertainment and delectable eats is closer than you’ve ever imagined!
Each of our one-bedroom apartment homes comes standard with two-tone designer paint, modern vinyl flooring and finishes, granite countertops and more!
With professional management, around the clock emergency maintenance and off-street parking, it’s easy to kick off your shoes and relax knowing we’re here to provide outstanding customer service in a prompt and efficient manner.
We invite you to browse our availability and photo gallery to get a closer look at life at Clinton Place. If one of our apartments or amenities catch your eye, contact us today to schedule a personalized tour.
**Prospective tenant's have the right to provide a portable tenant screening report, as defined in section 38-12-902(2.5), Colorado Revised Statutes.
Home Values in the Area
Average Home Value in this Area
Property History
| Date | Event | Price | List to Sale | Price per Sq Ft |
|---|---|---|---|---|
| 04/28/2026 04/28/26 | Off Market | $923 | -- | -- |
| 03/24/2026 03/24/26 | Price Changed | $923 | +7.0% | $2 / Sq Ft |
| 02/24/2026 02/24/26 | For Rent | $863 | 0.0% | -- |
| 02/20/2026 02/20/26 | Off Market | $863 | -- | -- |
| 02/12/2026 02/12/26 | For Rent | $863 | 0.0% | -- |
| 02/10/2026 02/10/26 | Off Market | $863 | -- | -- |
| 01/21/2026 01/21/26 | Price Changed | $863 | +10.2% | $2 / Sq Ft |
| 01/08/2026 01/08/26 | Price Changed | $783 | -2.5% | $1 / Sq Ft |
| 12/24/2025 12/24/25 | Price Changed | $803 | 0.0% | $1 / Sq Ft |
| 12/24/2025 12/24/25 | For Rent | $803 | -19.3% | -- |
| 09/17/2025 09/17/25 | Off Market | $995 | -- | -- |
| 08/18/2025 08/18/25 | Price Changed | $995 | +11.2% | $2 / Sq Ft |
| 08/08/2025 08/08/25 | Price Changed | $895 | 0.0% | $2 / Sq Ft |
| 08/08/2025 08/08/25 | For Rent | $895 | -5.3% | -- |
| 07/06/2025 07/06/25 | Off Market | $945 | -- | -- |
| 06/19/2025 06/19/25 | Price Changed | $945 | -5.0% | $2 / Sq Ft |
| 05/19/2025 05/19/25 | Price Changed | $995 | +11.2% | $2 / Sq Ft |
| 04/12/2025 04/12/25 | For Rent | $895 | 0.0% | -- |
| 03/05/2025 03/05/25 | Off Market | $895 | -- | -- |
| 02/06/2025 02/06/25 | Price Changed | $895 | -3.2% | $2 / Sq Ft |
| 01/27/2025 01/27/25 | Price Changed | $925 | -7.0% | $2 / Sq Ft |
| 01/16/2025 01/16/25 | Price Changed | $995 | -9.1% | $2 / Sq Ft |
| 01/07/2025 01/07/25 | Price Changed | $1,095 | +19.7% | $2 / Sq Ft |
| 11/21/2024 11/21/24 | Price Changed | $915 | -3.2% | $2 / Sq Ft |
| 11/14/2024 11/14/24 | Price Changed | $945 | -5.0% | $2 / Sq Ft |
| 10/23/2024 10/23/24 | Price Changed | $995 | -4.8% | $2 / Sq Ft |
| 10/15/2024 10/15/24 | Price Changed | $1,045 | +5.0% | $2 / Sq Ft |
| 10/14/2024 10/14/24 | Price Changed | $995 | 0.0% | $2 / Sq Ft |
| 10/14/2024 10/14/24 | For Rent | $995 | -4.8% | -- |
| 09/27/2024 09/27/24 | Price Changed | $1,045 | 0.0% | $2 / Sq Ft |
| 09/27/2024 09/27/24 | For Rent | $1,045 | +5.0% | -- |
| 01/25/2024 01/25/24 | Price Changed | $995 | -2.9% | $2 / Sq Ft |
| 12/22/2023 12/22/23 | Price Changed | $1,025 | -1.9% | $2 / Sq Ft |
| 12/13/2023 12/13/23 | Price Changed | $1,045 | -1.9% | $2 / Sq Ft |
| 11/16/2023 11/16/23 | Price Changed | $1,065 | +4.9% | $2 / Sq Ft |
| 10/27/2023 10/27/23 | For Rent | $1,015 | 0.0% | -- |
| 08/07/2023 08/07/23 | For Rent | $1,015 | 0.0% | -- |
| 06/21/2023 06/21/23 | For Rent | $1,015 | 0.0% | -- |
| 06/15/2023 06/15/23 | For Rent | $1,015 | 0.0% | -- |
| 08/23/2022 08/23/22 | For Rent | $1,015 | -- | -- |
Tax History
| Year | Tax Paid | Tax Assessment Tax Assessment Total Assessment is a certain percentage of the fair market value that is determined by local assessors to be the total taxable value of land and additions on the property. | Land | Improvement |
|---|---|---|---|---|
| 2025 | $12,877 | $115,670 | $11,660 | $104,010 |
| 2024 | $12,877 | $106,320 | $10,720 | $95,600 |
| 2023 | $13,082 | $126,510 | $3,870 | $122,640 |
| 2022 | $13,421 | $118,110 | $3,890 | $114,220 |
| 2021 | $14,289 | $118,110 | $3,890 | $114,220 |
| 2020 | $10,446 | $88,520 | $4,090 | $84,430 |
| 2019 | $10,753 | $88,520 | $4,090 | $84,430 |
| 2018 | $7,906 | $66,830 | $4,110 | $62,720 |
| 2017 | $7,024 | $66,830 | $4,110 | $62,720 |
| 2016 | $4,487 | $42,340 | $4,550 | $37,790 |
| 2015 | $4,346 | $42,340 | $4,550 | $37,790 |
| 2014 | -- | $46,210 | $4,550 | $41,660 |
Map
- 1638 Chester St Unit 1638
- 1685 Chester St
- 1717 Clinton St
- 1654 Beeler St
- 1646 Beeler St
- 1548 Chester St
- 1738 Boston St
- 1558 Dallas St
- 1915 Dallas St
- 1695 Alton St
- 1480 Boston St
- 1720 Del Mar Pkwy
- 1777 Alton St
- 1989 Beeler St
- 1392 Akron St
- 1973 Alton St
- 1390 Alton St
- 1785 Florence St
- 9000 Montview Blvd
- 1350 Dallas St
- 1648 Chester St Unit 1648
- 1648 Chester St
- 1646 Chester St Unit 1646
- 1650 Chester St Unit 1650
- 1644 Chester St Unit 1644
- 1644 Chester St
- 1652 Chester St Unit 1652
- 1642 Chester St Unit 1642
- 1636 Chester St Unit 1636
- 1636 Chester St Unit Bldg 1
- 1636 Chester St Unit 11636
- 1640 Chester St Unit 1640
- 1634 Chester St Unit 1634
- 1632 Chester St Unit 1632
- 1632 Chester St Unit 1
- 1630 Chester St Unit 1630
- 1666 Chester St
- 1624 Chester St
- 1670 Chester St
- 1657 Clinton St
Ask me questions while you tour the home.