P
Seller's Agent in 2015
Pamela Cordes-Redding
Berkshire Hathaway HomeServices Speckman Realty


Estimated Value: $342,000 - $394,000
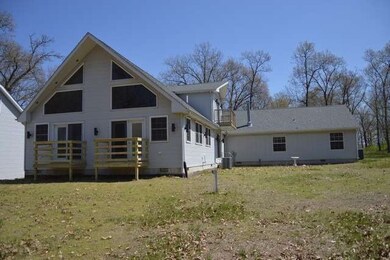
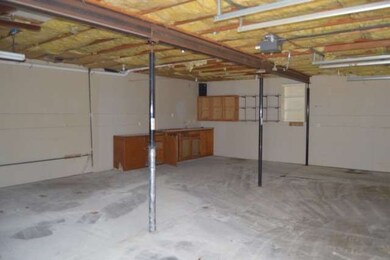
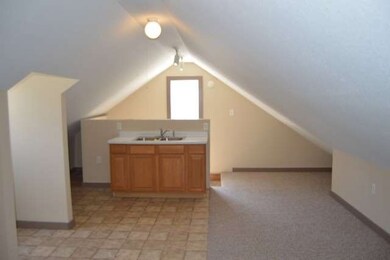
Beautiful home on a 6-acre wooded lot. Freshly painted/new carpeting. 3D garage w/apartment & 2 full baths. New SS Appliances. Pre-approval LTR &/or POF required w/all offers. Buyers can obtain a free pre-qual LTR from Wells Fargo Home Loans. PAS provides a standard seller's addendum once an offer has been accepted. See attachment for PAS requirements & WFHM offer submittal info in MLS document section.
Last Agent to Sell the Property
Pamela Cordes-Redding
Berkshire Hathaway HomeServices Speckman Realty License #475133991 Listed on: 05/14/2015
| Date | Buyer | Sale Price | Title Company |
|---|---|---|---|
| Nicholson Anne R | $212,000 | Stewart Title |
| Date | Status | Borrower | Loan Amount |
|---|---|---|---|
| Previous Owner | Nicholson Anne R | $175,028 |
| Date | Event | Price | List to Sale | Price per Sq Ft |
|---|---|---|---|---|
| 09/25/2015 09/25/15 | Sold | $188,000 | -16.4% | $49 / Sq Ft |
| 06/25/2015 06/25/15 | Pending | -- | -- | -- |
| 05/14/2015 05/14/15 | For Sale | $225,000 | -- | $58 / Sq Ft |
| Year | Tax Paid | Tax Assessment Tax Assessment Total Assessment is a certain percentage of the fair market value that is determined by local assessors to be the total taxable value of land and additions on the property. | Land | Improvement |
|---|---|---|---|---|
| 2024 | $6,316 | $81,766 | $12,265 | $69,501 |
| 2023 | $5,890 | $73,333 | $11,000 | $62,333 |
| 2022 | $5,626 | $66,666 | $10,000 | $56,666 |
| 2021 | $3,781 | $45,113 | $964 | $44,149 |
| 2020 | $3,905 | $42,459 | $907 | $41,552 |
| 2019 | $3,649 | $39,868 | $852 | $39,016 |
| 2018 | $3,608 | $39,278 | $839 | $38,439 |
| 2017 | $3,469 | $38,414 | $821 | $37,593 |
| 2016 | $3,365 | $37,115 | $793 | $36,322 |
| 2015 | $3,252 | $35,517 | $759 | $34,758 |
| 2014 | $6,689 | $67,762 | $740 | $67,022 |
| 2013 | -- | $68,969 | $753 | $68,216 |
P
Seller's Agent in 2015
Pamela Cordes-Redding
Berkshire Hathaway HomeServices Speckman Realty

Buyer's Agent in 2015
Peter Grant
Berkshire Hathaway HomeServices Speckman Realty
(815) 405-8610
138 Total Sales
Source: Midwest Real Estate Data (MRED)
MLS Number: MRD08922948
APN: 10-20-07-200-004
Disclaimer: Certain information contained herein is derived from information provided by parties other than Homes.com. All information provided is deemed reliable, but is not guaranteed to be accurate and should be independently verified.
![]() Based on information submitted to the MLS GRID. All data is obtained from various sources and may not have been verified by broker or MLS GRID. Supplied Open House Information is subject to change without notice. All information should be independently reviewed and verified for accuracy. Properties may or may not be listed by the office/agent presenting the information. Some IDX listings have been excluded from this website.
Based on information submitted to the MLS GRID. All data is obtained from various sources and may not have been verified by broker or MLS GRID. Supplied Open House Information is subject to change without notice. All information should be independently reviewed and verified for accuracy. Properties may or may not be listed by the office/agent presenting the information. Some IDX listings have been excluded from this website.
Based on information submitted to the MLS GRID
Ask me questions while you tour the home.