0 Champlain Rd Salem, MA 01970
Castle Hill NeighborhoodEstimated Value: $585,622 - $645,000
2
Beds
1
Bath
1,386
Sq Ft
$451/Sq Ft
Est. Value
About This Home
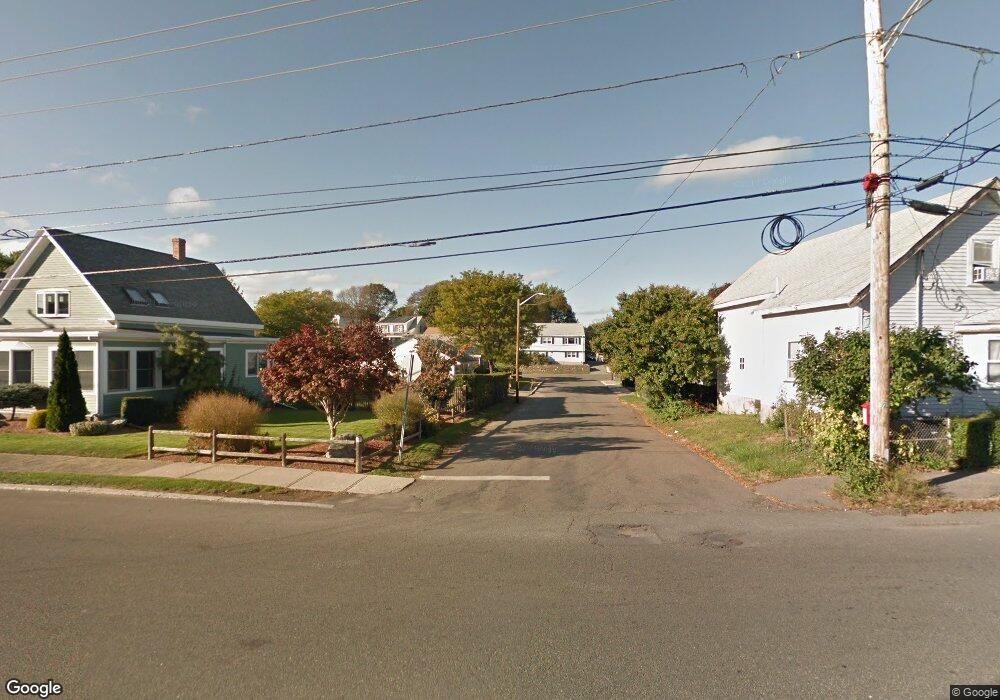
This home is located at 0 Champlain Rd, Salem, MA 01970 and is currently estimated at $624,406, approximately $450 per square foot. 0 Champlain Rd is a home located in Essex County with nearby schools including Horace Mann Laboratory, Saltonstall School, and Witchcraft Heights Elementary School.
Ownership History
Date
Name
Owned For
Owner Type
Purchase Details
Closed on
Oct 11, 2011
Sold by
Quinn-Lebrun Carol A
Bought by
Quinn Carol A and Quinn Lebrun T
Current Estimated Value
Purchase Details
Closed on
May 29, 1998
Sold by
Tarnowski Robert S and Tarnowski Jacqueline
Bought by
Andrews Carole L
Home Financials for this Owner
Home Financials are based on the most recent Mortgage that was taken out on this home.
Original Mortgage
$100,000
Interest Rate
7.12%
Mortgage Type
Purchase Money Mortgage
Purchase Details
Closed on
Dec 8, 1987
Sold by
Gauthier Ernest J
Bought by
Gallant Jeanne C
Create a Home Valuation Report for This Property
The Home Valuation Report is an in-depth analysis detailing your home's value as well as a comparison with similar homes in the area
Home Values in the Area
Average Home Value in this Area
Purchase History
| Date | Buyer | Sale Price | Title Company |
|---|---|---|---|
| Quinn Carol A | -- | -- | |
| Andrews Carole L | $152,500 | -- | |
| Gallant Jeanne C | $50,000 | -- |
Source: Public Records
Mortgage History
| Date | Status | Borrower | Loan Amount |
|---|---|---|---|
| Previous Owner | Gallant Jeanne C | $100,000 | |
| Previous Owner | Gallant Jeanne C | $240,000 |
Source: Public Records
Tax History
| Year | Tax Paid | Tax Assessment Tax Assessment Total Assessment is a certain percentage of the fair market value that is determined by local assessors to be the total taxable value of land and additions on the property. | Land | Improvement |
|---|---|---|---|---|
| 2025 | $5,980 | $527,300 | $196,500 | $330,800 |
| 2024 | $6,013 | $517,500 | $186,700 | $330,800 |
| 2023 | $5,783 | $462,300 | $172,300 | $290,000 |
| 2022 | $5,329 | $402,200 | $166,600 | $235,600 |
| 2021 | $5,145 | $372,800 | $155,100 | $217,700 |
| 2020 | $4,942 | $342,000 | $146,500 | $195,500 |
| 2019 | $4,830 | $319,900 | $139,000 | $180,900 |
| 2018 | $4,702 | $305,700 | $132,100 | $173,600 |
| 2017 | $4,450 | $280,600 | $111,400 | $169,200 |
| 2016 | $4,317 | $275,500 | $106,300 | $169,200 |
| 2015 | $4,081 | $248,700 | $97,700 | $151,000 |
Source: Public Records
Map
Nearby Homes
- 29 Willson St
- 6 Arthur St Unit 3
- 79 Lawrence St
- 5 Willson Rd
- 15 Francis Rd
- 6R Hazel Terrace Unit 1
- 10 Hazel St Unit 2
- 106 Broadway Unit 3
- 2 Halsey Way Unit 40C
- 81 Loring Ave
- 16 Phelps St Unit 16-1
- 15 Phelps St Unit 1
- 18 Dalton Pkwy Unit 18
- 4 Valley St
- 5 Gardner St Unit 3
- 4 Willow Ave Unit 2
- 7 Fairfield St
- 22 Prescott St Unit 1
- 29 Ocean Ave Unit 4
- 8 Russell Dr Unit 7D
Your Personal Tour Guide
Ask me questions while you tour the home.