0 Chateau Ridge Ct Unit 33753472 Tomball, TX 77375
Estimated Value: $1,981,000 - $2,644,595
5
Beds
9
Baths
6,848
Sq Ft
$319/Sq Ft
Est. Value
About This Home
This home is located at 0 Chateau Ridge Ct Unit 33753472, Tomball, TX 77375 and is currently estimated at $2,182,399, approximately $318 per square foot. 0 Chateau Ridge Ct Unit 33753472 is a home located in Harris County with nearby schools including Rosehill Elementary School, Tomball Intermediate School, and Tomball Junior High School.
Ownership History
Date
Name
Owned For
Owner Type
Purchase Details
Closed on
Jun 9, 2022
Sold by
Williams Charles E and Williams Stacy L
Bought by
Thompson Randall J and Thompson Lisa M
Current Estimated Value
Purchase Details
Closed on
Feb 17, 2017
Sold by
Penley Chad and Penley Katrina B
Bought by
Williams Kevin and Williams April
Home Financials for this Owner
Home Financials are based on the most recent Mortgage that was taken out on this home.
Original Mortgage
$400,000
Interest Rate
4.12%
Mortgage Type
Commercial
Purchase Details
Closed on
May 16, 2016
Sold by
Boyer Equipment
Bought by
Jaderock Homes Llc
Purchase Details
Closed on
May 11, 2016
Sold by
Jaderock Homes Llc
Bought by
Williams Charles R and Williams Stacy L
Create a Home Valuation Report for This Property
The Home Valuation Report is an in-depth analysis detailing your home's value as well as a comparison with similar homes in the area
Home Values in the Area
Average Home Value in this Area
Purchase History
| Date | Buyer | Sale Price | Title Company |
|---|---|---|---|
| Thompson Randall J | -- | Stewart Title | |
| Williams Kevin | -- | First American Title | |
| Jaderock Homes Llc | -- | Stewart Title | |
| Williams Charles R | -- | Stewart Title |
Source: Public Records
Mortgage History
| Date | Status | Borrower | Loan Amount |
|---|---|---|---|
| Previous Owner | Williams Kevin | $400,000 |
Source: Public Records
Tax History Compared to Growth
Tax History
| Year | Tax Paid | Tax Assessment Tax Assessment Total Assessment is a certain percentage of the fair market value that is determined by local assessors to be the total taxable value of land and additions on the property. | Land | Improvement |
|---|---|---|---|---|
| 2025 | $46,175 | $2,100,000 | $453,344 | $1,646,656 |
| 2024 | $46,175 | $2,555,000 | $453,344 | $2,101,656 |
| 2023 | $46,175 | $2,095,000 | $352,601 | $1,742,399 |
| 2022 | $22,783 | $1,098,966 | $352,601 | $746,365 |
| 2021 | $22,467 | $1,048,595 | $302,230 | $746,365 |
| 2020 | $23,221 | $1,048,595 | $251,858 | $796,737 |
| 2019 | $25,967 | $1,137,437 | $251,858 | $885,579 |
| 2018 | $12,967 | $568,000 | $94,357 | $473,643 |
| 2017 | $2,661 | $118,620 | $118,620 | $0 |
| 2016 | $2,661 | $118,620 | $118,620 | $0 |
| 2015 | $821 | $118,620 | $118,620 | $0 |
| 2014 | $821 | $75,485 | $75,485 | $0 |
Source: Public Records
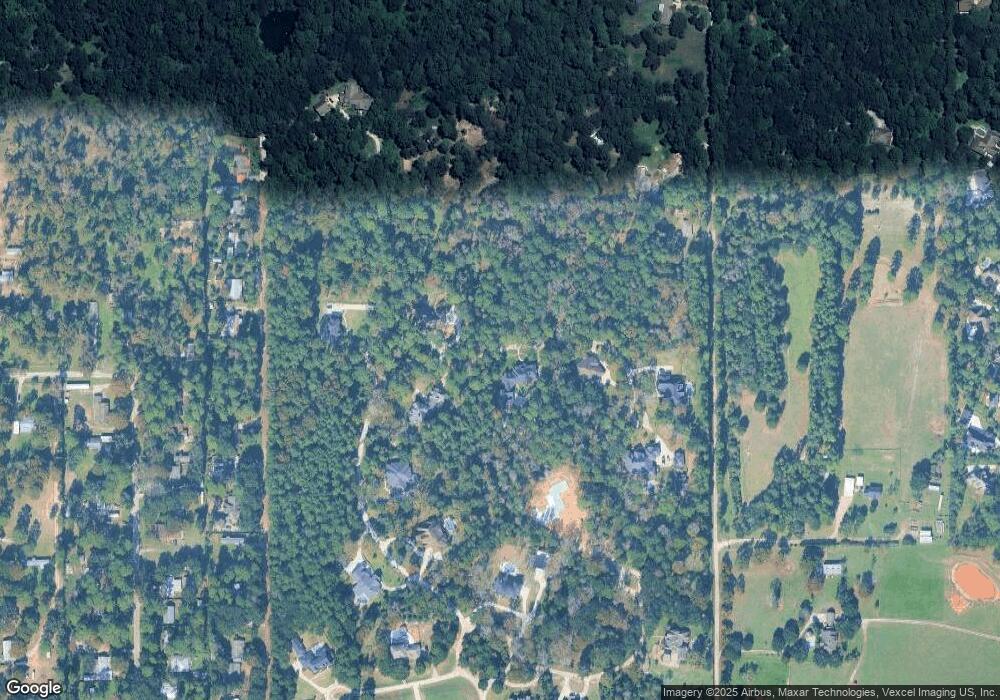
Map
Nearby Homes
- 19309 Whispering Grove E
- 22508 Rosehurst Dr
- 19414 W Whispering Grove
- 19332 Chateau Ridge Ct
- 22827 Edward Ln
- 22609 E Meadowhurst Cir
- 22114 E Meadowhurst Cir
- 18926 Wildrose Ln
- 18902 Meadow Ln
- 18910 Chickadee Ln
- 22111 Loblolly Dr
- 22111 Loblolly Rd
- 22014 Main Blvd
- 22022 Loblolly Dr
- TBD Rosewood Trail
- 19603 Fm 2920 Rd
- 30403 Walnut Creek Rd
- 27736 Woodglen Mews Way
- 27728 Woodglen Mews Way
- 27724 Woodglen Mews Way
- 0 Chateau Ridge Ct Unit 403621
- 19303 Chateau Ridge Ct
- 19302 Chateau Ridge Ct
- 19302 Whispering Grove E
- 0 Whispering Grove E Unit 33864770
- 19315 Chateau Ridge Ct
- 19327 Chateau Ridge Ct
- 0 Whispering Gr Unit 23588526
- 0 Whispering Gr Unit 43683032
- 0 Whispering Gr Unit 24534247
- 0 Whispering Gr Unit 21119512
- 00 Chateau Ridge Ct
- 2401 Chateau Ridge Ct
- 2301 Chateau Ridge Ct
- 2201 Chateau Ridge Ct
- 2101 Chateau Ridge Ct
- 19314 Chateau Ridge Ct
- 19322 Whispering Gr
- 19322 Whispering Grove E
- 19333 Whispering Grove E