$229,600

0 E Road 143 Unit 11605405 Gurley, NE 69149

Estimated payment $1,305/month

158.99 Acres
$1,444 Price per Acre
6,925,604 Sq Ft Lot

About This Lot

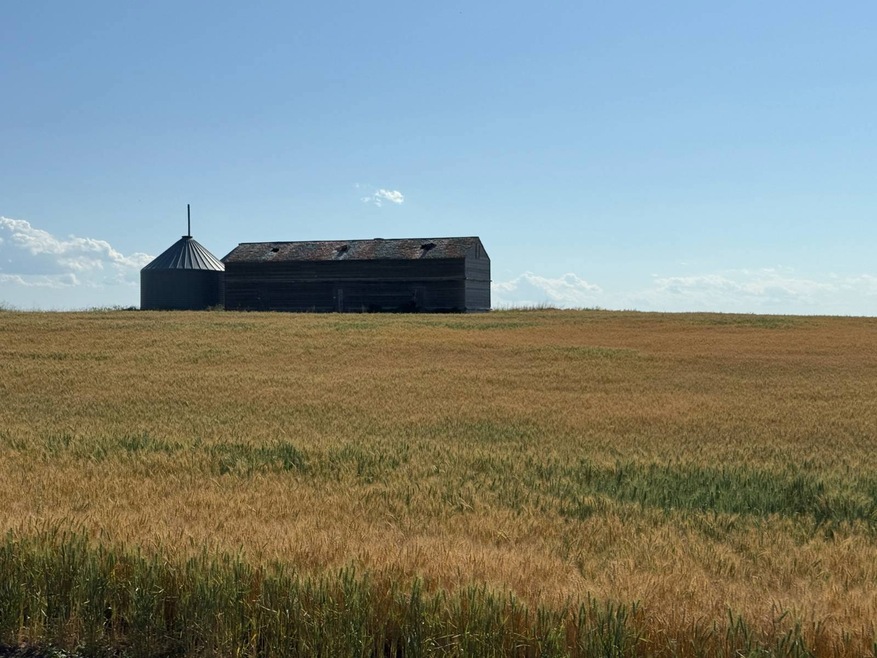
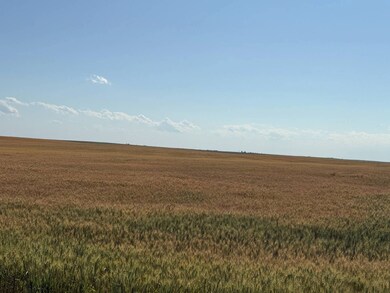
158.99± acres of quality dry cropland farm in Cheyenne County, Nebraska. Currently in wheat rotation, with excellent county road access and located in a progressive farming community near Gurley, Nebraska. This parcel also features an old site, complete with 3 steel bins totaling over 9,700 bu storage capacity and older granary building.

Listing Agent

Tony Eggleston

Agri Affiliates, Inc. Listed on: 10/31/2025

Property Details

Property Type

  • Land

Est. Annual Taxes

  • $1,138

Additional Features

  • Views of a Farm
  • Outbuilding
  • 158.99 Acre Lot

Property Details

Property Type

Land

Est. Annual Taxes

$1,138

Lot Details

0

Listing Details

  • Directions To Property: From Gurley, Nebraska, travel east on Road 46 for 15 miles, then north on Road 143 for 3 miles to the east side of the property.
  • HamletID: 0
  • LandRentAmount: 0
  • Lot Size Acres: 158.99
  • Number Of Stories: 0
  • OutbuildingGeneral: Yes
  • PercentageOfTaxThatIsDeductable: 0
  • PropertyCity: Gurley
  • Prop. Type: Vacant Land
  • Renovation Year: 0
  • SForSaleAndRForRental: S
  • USStateAbbreviation: NE
  • ViewFarm: Yes
  • Special Features: None
  • Property Sub Type: LotsLands
  • Stories: 0

Interior Features

  • Fireplaces: 0
  • AboveArea Sq Ft: 0

Garage/Parking

  • AttachedParking: 0
  • Numberof Garage Spaces: 0

Condo/Co-op/Association

  • HOA Fees: 0
  • Units in Building: 0

Lot Info

  • Number Of Lots: 0

Multi Family

  • Unit Number of Bedrooms: 0
  • Total Taxes: 1138

Tax Info

  • Tax Year: 2024

Map

Range of Values:

Collateral Analytics

Collateral Analytics Collateral Analytics AVMs (Automated Valuation Model) employ a number of statistical approaches combined with neighborhood-specific comparable selection guarantees the most up-to-date and precise valuations.

Not Available

Collateral Analytics does not have data for the current month. Please view the chart for historical values.

ICE

ICE Mortgage Technology ICE Mortgage Technology’s AVM (Automated Valuation Model) is a state-of-the-art online residential property valuation tool that provides a quick and accurate estimate of the value of almost any home in the U.S.

Not Available

ICE Mortgage Technology does not have data for the current month. Please view the chart for historical values.

First American

First American First American Data & Analytics’ next-generation AVM combines unrivaled data assets with a blended ensemble of valuation models to produce highly accurate, reliable valuations you can trust.

Not Available

First American does not have data for the current month. Please view the chart for historical values.

Quantarium

Quantarium Quantarium’s valuation service, repeatedly proven the industry’s most accurate and comprehensive, is supercharged with a self-learning and auto-tuning AI engine that continually becomes smarter and more accurate as it processes daily inputs from the industry’s leading RE data lake.

Not Available

Quantarium does not have data for the current month. Please view the chart for historical values.

Average Value
Not Available
List Price
Sold Price
Create a Home Valuation Report for This Property
The Home Valuation Report is an in-depth analysis detailing your home's value as well as a comparison with similar homes in the area

Home Values in the Area

Source: Public Records

Average Home Value in this Area


Source: Public Records

Tax History

Year Tax Paid Tax Assessment Tax Assessment Total Assessment is a certain percentage of the fair market value that is determined by local assessors to be the total taxable value of land and additions on the property. Land Improvement
2024 $1,138 $109,685 $108,305 $1,380
2023 $1,511 $109,405 $108,305 $1,100
2022 $1,411 $100,745 $99,645 $1,100
2021 $1,358 $98,770 $97,795 $975
2020 $1,424 $103,259 $102,284 $975
2019 $1,493 $117,001 $116,026 $975
2018 $1,585 $133,829 $132,854 $975
2017 $1,760 $154,560 $150,867 $3,693
2016 $1,837 $156,360 $150,867 $5,493
2015 $1,609 $130,015 $124,522 $5,493
2014 $1,542 $108,859 $103,366 $5,493
Source: Public Records

Property History

Date Event Price List to Sale Price per Sq Ft
10/31/2025 10/31/25 For Sale $229,600 -- --
Source: My State MLS

Source: My State MLS

MLS Number: 11605405

APN: 170033953