Estimated Value: $356,000 - $555,862
--
Bed
--
Bath
2,805
Sq Ft
$165/Sq Ft
Est. Value
About This Home
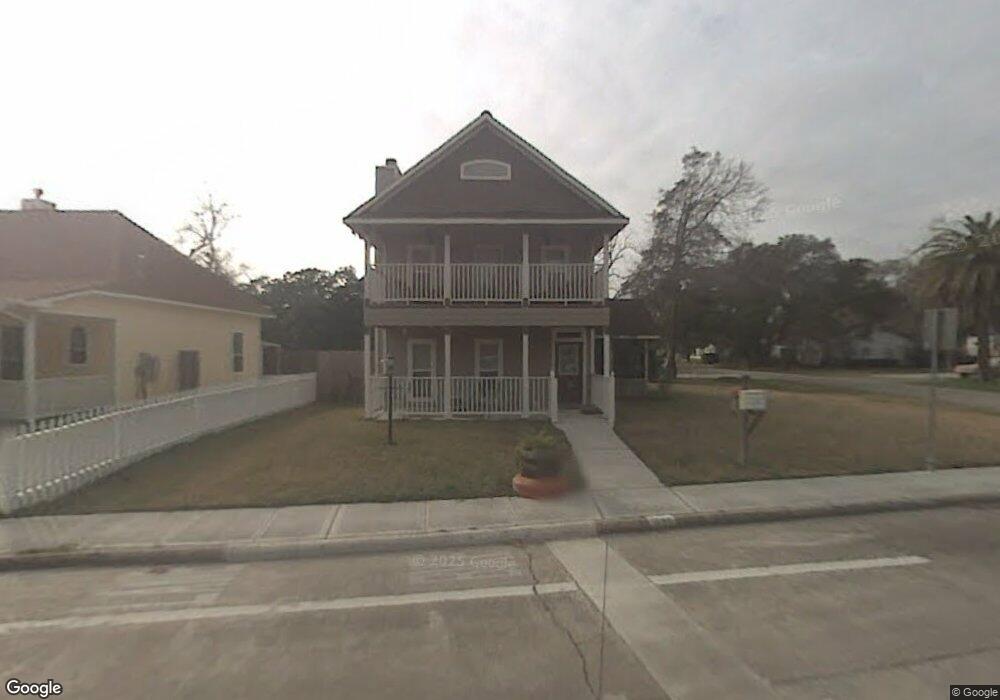
This home is located at 0 George St, Alvin, TX 77511 and is currently estimated at $462,466, approximately $164 per square foot. 0 George St is a home located in Brazoria County with nearby schools including Alvin Elementary School, Fairview Junior High School, and Alvin High School.
Ownership History
Date
Name
Owned For
Owner Type
Purchase Details
Closed on
Aug 26, 2014
Sold by
Ouellette Matthew and Ouellette Tami
Bought by
Hoover Michael and Hoover Susan
Current Estimated Value
Purchase Details
Closed on
Apr 4, 2007
Sold by
Bennett Mark Allen and Bennett Susan Elsie Simmons
Bought by
Ouellette Matthew and Ouellette Tami
Home Financials for this Owner
Home Financials are based on the most recent Mortgage that was taken out on this home.
Original Mortgage
$51,360
Interest Rate
6.24%
Mortgage Type
Purchase Money Mortgage
Create a Home Valuation Report for This Property
The Home Valuation Report is an in-depth analysis detailing your home's value as well as a comparison with similar homes in the area
Home Values in the Area
Average Home Value in this Area
Purchase History
| Date | Buyer | Sale Price | Title Company |
|---|---|---|---|
| Hoover Michael | -- | Stewart Title | |
| Ouellette Matthew | -- | Alamo Title 4 |
Source: Public Records
Mortgage History
| Date | Status | Borrower | Loan Amount |
|---|---|---|---|
| Previous Owner | Ouellette Matthew | $51,360 |
Source: Public Records
Tax History Compared to Growth
Tax History
| Year | Tax Paid | Tax Assessment Tax Assessment Total Assessment is a certain percentage of the fair market value that is determined by local assessors to be the total taxable value of land and additions on the property. | Land | Improvement |
|---|---|---|---|---|
| 2025 | $8,116 | $524,300 | $145,930 | $378,370 |
| 2023 | $8,116 | $495,000 | $103,190 | $476,810 |
| 2022 | $12,343 | $450,000 | $103,190 | $346,810 |
| 2021 | $13,026 | $518,060 | $107,310 | $410,750 |
| 2020 | $12,005 | $410,160 | $82,550 | $327,610 |
| 2019 | $12,390 | $416,620 | $68,790 | $347,830 |
| 2018 | $11,284 | $375,000 | $68,790 | $306,210 |
| 2017 | $10,855 | $356,250 | $68,790 | $287,460 |
| 2016 | $1,572 | $51,590 | $51,590 | $0 |
| 2015 | $1,737 | $51,590 | $51,590 | $0 |
| 2014 | $1,737 | $55,890 | $55,890 | $0 |
Source: Public Records
Map
Nearby Homes
- 914 S Hill St
- 1012 S Lee St
- 1020 S Booth Ln
- 1216 S Hill St
- 209 E Foley St
- 222 E Southland Ave
- 304 E Foley St
- 1302 Cypress St
- 710 S Jackson St
- 313 E Dumble St
- 403 S Hill St Unit L
- 225 Foster St
- 417 W Blum St
- 903 Dula St
- 816 W Adoue St
- 303 S Jackson St
- 514 E Foley St
- 2710 Hackberry Run
- 208 W Jordan St
- 412 W Sidnor St