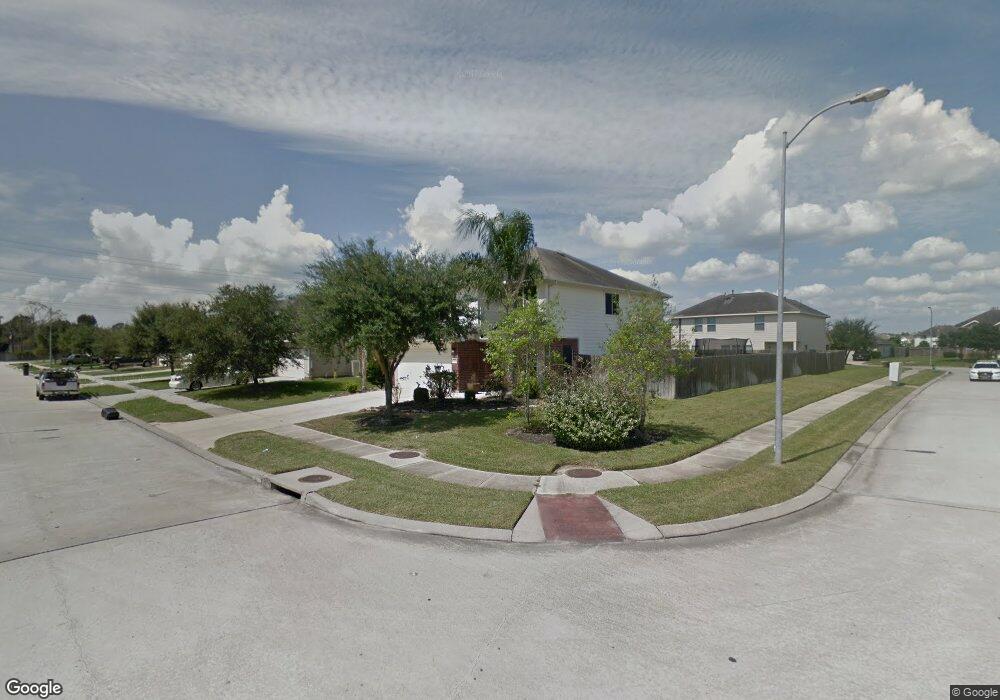
0 Harbour Lake Ct Unit 16604574 Humble, TX 77396
Lindsey NeighborhoodEstimated Value: $248,091 - $265,000
3
Beds
2
Baths
1,743
Sq Ft
$145/Sq Ft
Est. Value
About This Home
This home is located at 0 Harbour Lake Ct Unit 16604574, Humble, TX 77396 and is currently estimated at $253,273, approximately $145 per square foot. 0 Harbour Lake Ct Unit 16604574 is a home located in Harris County with nearby schools including Ridge Creek Elementary, Middle #10, and Summer Creek High School.
Ownership History
Date
Name
Owned For
Owner Type
Purchase Details
Closed on
Mar 15, 2019
Sold by
Lopez Bryant J and Lopez Abigail
Bought by
Maldonado Leoncio Vargas
Current Estimated Value
Home Financials for this Owner
Home Financials are based on the most recent Mortgage that was taken out on this home.
Original Mortgage
$157,500
Outstanding Balance
$138,469
Interest Rate
4.4%
Mortgage Type
New Conventional
Estimated Equity
$114,804
Purchase Details
Closed on
Oct 3, 2016
Sold by
Perez Jose and Perez Monica
Bought by
Lopez Bryant J and Lopez Abigail
Home Financials for this Owner
Home Financials are based on the most recent Mortgage that was taken out on this home.
Original Mortgage
$152,000
Interest Rate
3.43%
Mortgage Type
New Conventional
Purchase Details
Closed on
Jun 24, 2013
Sold by
Land Development Inc
Bought by
Perez Jose and Perez Monica
Create a Home Valuation Report for This Property
The Home Valuation Report is an in-depth analysis detailing your home's value as well as a comparison with similar homes in the area
Home Values in the Area
Average Home Value in this Area
Purchase History
| Date | Buyer | Sale Price | Title Company |
|---|---|---|---|
| Maldonado Leoncio Vargas | -- | None Available | |
| Lopez Bryant J | -- | Stewart Title Houston Div | |
| Perez Jose | -- | Chicago Title |
Source: Public Records
Mortgage History
| Date | Status | Borrower | Loan Amount |
|---|---|---|---|
| Open | Maldonado Leoncio Vargas | $157,500 | |
| Previous Owner | Lopez Bryant J | $152,000 |
Source: Public Records
Tax History Compared to Growth
Tax History
| Year | Tax Paid | Tax Assessment Tax Assessment Total Assessment is a certain percentage of the fair market value that is determined by local assessors to be the total taxable value of land and additions on the property. | Land | Improvement |
|---|---|---|---|---|
| 2025 | $6,815 | $242,722 | $53,358 | $189,364 |
| 2024 | $6,815 | $246,452 | $24,011 | $222,441 |
| 2023 | $6,815 | $255,223 | $24,011 | $231,212 |
| 2022 | $6,624 | $225,624 | $24,011 | $201,613 |
| 2021 | $5,637 | $183,773 | $24,011 | $159,762 |
| 2020 | $5,593 | $175,720 | $24,011 | $151,709 |
| 2019 | $5,853 | $176,124 | $24,011 | $152,113 |
| 2018 | $2,387 | $157,007 | $22,410 | $134,597 |
| 2017 | $5,280 | $157,007 | $22,410 | $134,597 |
| 2016 | $4,733 | $140,726 | $22,410 | $118,316 |
| 2015 | $1,895 | $132,185 | $22,410 | $109,775 |
| 2014 | $1,895 | $55,188 | $22,410 | $32,778 |
Source: Public Records
Map
Nearby Homes
- 11123 Drakeland Dr
- 11111 Clear Fork Dr
- 15026 Sunset Creek Dr
- 11019 Drakeland Dr
- 11023 Almond Grove
- 15031 Arizona Sky Ct
- 10915 Clear Fork Dr
- 10910 Drakeland Dr
- 15214 Central Lakes Dr
- 15203 Albert Oak Dr
- 15102 Dry Ridge Ct
- 10826 Thorncliff Dr
- 15243 Crescent Brookfield Dr
- 10811 Kentington Oak Dr
- 15123 Sun Glaze Ct
- 15302 Albert Oak Dr
- 15318 Central Lakes Dr
- 10727 Kentington Oak Dr
- 12006 Loch Muick Dr
- 11034 Hillside Creek Dr
- 0 Harbour Lake Ct Unit 65390450
- 11338 Harbour Lake Ct
- 11334 Harbour Lake Ct
- 11342 Harbour Lake Ct
- 11330 Harbour Lake Ct
- 11326 Harbour Lake Ct
- 11339 Harbour Lake Ct
- 11335 Harbour Lake Ct
- 11343 Harbour Lake Ct
- 11402 Harbour Lake Ct
- 11331 Harbour Lake Ct
- 11322 Harbour Lake Ct
- 11327 Harbour Lake Ct
- 11406 Harbour Lake Ct
- 11403 Harbour Lake Ct
- 11318 Harbour Lake Ct
- 11323 Harbour Lake Ct
- 11334 Moonlight Ridge Dr
- 11410 Harbour Lake Ct
- 11407 Harbour Lake Ct