
Seller's Agent in 2025
Jonathan Cisneros
ESO Realty, Inc.
(661) 418-6978
9 in this area
78 Total Sales

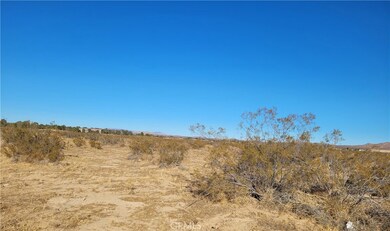
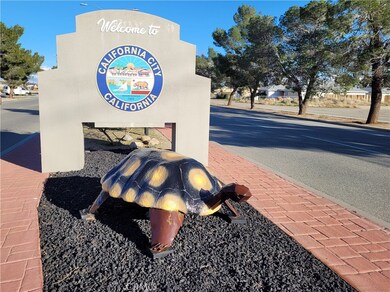
Large vacant lot off of California City Blvd on S Loop. Quiet neighborhood. Three lots available sold separately or as a bundle.
Last Agent to Sell the Property
DESERT ROSE REALTY Brokerage Phone: 760-373-6053 License #01973685 Listed on: 11/07/2024
| Date | Event | Price | Change | Sq Ft Price |
|---|---|---|---|---|
| 05/20/2025 05/20/25 | Sold | $20,000 | -13.0% | -- |
| 04/30/2025 04/30/25 | Pending | -- | -- | -- |
| 04/28/2025 04/28/25 | Price Changed | $23,000 | +15.0% | -- |
| 04/08/2025 04/08/25 | For Sale | $20,000 | -49.9% | -- |
| 02/28/2025 02/28/25 | For Sale | $39,950 | +185.4% | -- |
| 02/19/2025 02/19/25 | Sold | $14,000 | +133.3% | -- |
| 01/31/2025 01/31/25 | Sold | $6,000 | -40.0% | -- |
| 01/31/2025 01/31/25 | Sold | $10,000 | -16.7% | -- |
| 01/23/2025 01/23/25 | Pending | -- | -- | -- |
| 12/04/2024 12/04/24 | Pending | -- | -- | -- |
| 12/04/2024 12/04/24 | Pending | -- | -- | -- |
| 11/07/2024 11/07/24 | For Sale | $12,000 | -14.3% | -- |
| 11/07/2024 11/07/24 | For Sale | $14,000 | -17.6% | -- |
| 10/23/2024 10/23/24 | Price Changed | $17,000 | -29.2% | -- |
| 10/22/2024 10/22/24 | Off Market | $24,000 | -- | -- |
| 10/21/2024 10/21/24 | For Sale | $24,000 | +77.8% | -- |
| 09/24/2024 09/24/24 | Sold | $13,500 | -27.0% | -- |
| 09/13/2024 09/13/24 | Pending | -- | -- | -- |
| 08/23/2024 08/23/24 | For Sale | $18,500 | +2.8% | -- |
| 07/19/2024 07/19/24 | For Sale | $18,000 | -25.0% | -- |
| 06/23/2024 06/23/24 | Price Changed | $24,000 | +41.2% | -- |
| 06/04/2024 06/04/24 | Sold | $17,000 | -37.0% | -- |
| 04/23/2024 04/23/24 | Pending | -- | -- | -- |
| 10/11/2023 10/11/23 | For Sale | $27,000 | +170.0% | -- |
| 10/10/2023 10/10/23 | Sold | $10,000 | -44.4% | -- |
| 10/03/2023 10/03/23 | For Sale | $18,000 | +52.5% | -- |
| 09/15/2023 09/15/23 | Pending | -- | -- | -- |
| 06/19/2023 06/19/23 | Price Changed | $11,800 | -1.7% | -- |
| 03/20/2023 03/20/23 | Price Changed | $12,000 | -7.7% | -- |
| 10/25/2022 10/25/22 | Price Changed | $13,000 | -13.3% | -- |
| 08/16/2022 08/16/22 | For Sale | $15,000 | +130.8% | -- |
| 12/20/2021 12/20/21 | Sold | $6,500 | -13.3% | -- |
| 11/19/2021 11/19/21 | Pending | -- | -- | -- |
| 11/02/2021 11/02/21 | Sold | $7,500 | 0.0% | -- |
| 10/04/2021 10/04/21 | Pending | -- | -- | -- |
| 09/27/2021 09/27/21 | For Sale | $7,500 | -31.8% | -- |
| 07/27/2021 07/27/21 | Sold | $11,000 | +46.7% | -- |
| 04/29/2021 04/29/21 | For Sale | $7,500 | -16.7% | -- |
| 04/16/2021 04/16/21 | Pending | -- | -- | -- |
| 03/17/2021 03/17/21 | Sold | $9,000 | -5.3% | -- |
| 02/16/2021 02/16/21 | Pending | -- | -- | -- |
| 11/03/2020 11/03/20 | For Sale | $9,500 | -20.8% | -- |
| 02/29/2020 02/29/20 | For Sale | $12,000 | +242.9% | -- |
| 11/19/2019 11/19/19 | Sold | $3,500 | -65.0% | -- |
| 10/06/2019 10/06/19 | Pending | -- | -- | -- |
| 01/17/2019 01/17/19 | For Sale | $10,000 | +66.7% | -- |
| 06/21/2018 06/21/18 | Sold | $6,000 | -14.3% | -- |
| 05/17/2018 05/17/18 | Pending | -- | -- | -- |
| 12/04/2017 12/04/17 | For Sale | $7,000 | +133.3% | -- |
| 10/27/2016 10/27/16 | Sold | $3,000 | -14.3% | -- |
| 07/18/2016 07/18/16 | Pending | -- | -- | -- |
| 06/27/2016 06/27/16 | For Sale | $3,500 | -30.0% | -- |
| 06/26/2012 06/26/12 | Sold | $5,000 | 0.0% | -- |
| 06/15/2012 06/15/12 | Pending | -- | -- | -- |
| 06/23/2011 06/23/11 | For Sale | $5,000 | -- | -- |
Seller's Agent in 2025
Jonathan Cisneros
ESO Realty, Inc.
(661) 418-6978
9 in this area
78 Total Sales
Seller's Agent in 2025
Phillip Harvey
Phillip A.Harvey
(818) 800-9852
6 in this area
18 Total Sales
Seller's Agent in 2025
RENEE RIVERA
DESERT ROSE REALTY
(760) 373-6053
140 in this area
157 Total Sales
N
Buyer's Agent in 2025
NoEmail NoEmail
NONMEMBER MRML
(646) 541-2551
22 in this area
5,911 Total Sales
W
Buyer's Agent in 2025
Wendy Acosta
R
Seller's Agent in 2024
Rudy Lopez
West Coast Realty
(760) 977-7242
178 in this area
205 Total Sales
Source: California Regional Multiple Listing Service (CRMLS)
MLS Number: CV24230196
Disclaimer: Certain information contained herein is derived from information provided by parties other than Homes.com. All information provided is deemed reliable, but is not guaranteed to be accurate and should be independently verified.
![]() The multiple listing data appearing on this website, or contained in reports produced therefrom, is owned and copyrighted by California Regional Multiple Listing Service, Inc. ("CRMLS") and is protected by all applicable copyright laws. Information provided is for viewer's personal, non-commercial use and may not be used for any purpose other than to identify prospective properties the viewer may be interested in purchasing. All listing data, including but not limited to square footage and lot size is believed to be accurate, but the listing Agent, listing Broker and CRMLS and its affiliates do not warrant or guarantee such accuracy. The viewer should independently verify the listed data prior to making any decisions based on such information by personal inspection and/or contacting a real estate professional.
The multiple listing data appearing on this website, or contained in reports produced therefrom, is owned and copyrighted by California Regional Multiple Listing Service, Inc. ("CRMLS") and is protected by all applicable copyright laws. Information provided is for viewer's personal, non-commercial use and may not be used for any purpose other than to identify prospective properties the viewer may be interested in purchasing. All listing data, including but not limited to square footage and lot size is believed to be accurate, but the listing Agent, listing Broker and CRMLS and its affiliates do not warrant or guarantee such accuracy. The viewer should independently verify the listed data prior to making any decisions based on such information by personal inspection and/or contacting a real estate professional.
Based on information from California Regional Multiple Listing Service, Inc. and /or other sources. All data, including all measurements and calculations of area, is obtained from various sources and has not been, and will not be, verified by broker or MLS. All information should be independently reviewed and verified for accuracy. Properties may or may not be listed by the office/agent presenting the information