Estimated Value: $257,000 - $263,000
3
Beds
2
Baths
1,718
Sq Ft
$152/Sq Ft
Est. Value
About This Home
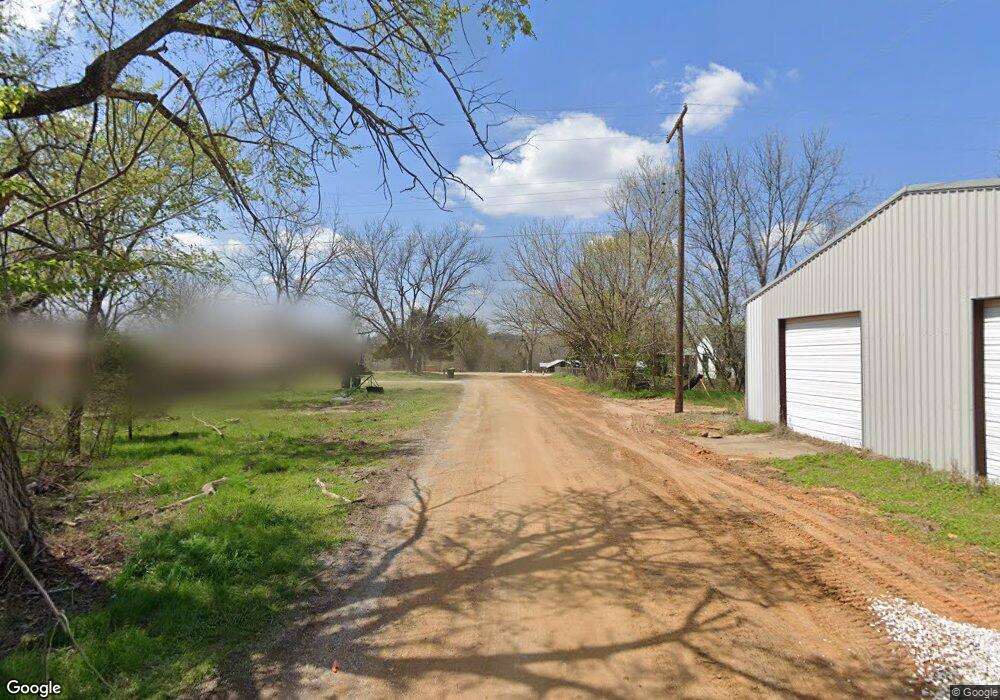
This home is located at 0 W Hwy 3 Rd W Unit 1823770, Ada, OK 74820 and is currently estimated at $260,734, approximately $151 per square foot. 0 W Hwy 3 Rd W Unit 1823770 is a home located in Pontotoc County with nearby schools including Vanoss Elementary School and Vanoss High School.
Ownership History
Date
Name
Owned For
Owner Type
Purchase Details
Closed on
Feb 23, 2017
Sold by
St Clair Ronnie and St Clair Denitia E
Bought by
St Clair Denitia E
Current Estimated Value
Purchase Details
Closed on
Oct 28, 2009
Sold by
Parsons Roy Fouglas and Parsons Mary M
Bought by
St Clair Denitia E and St Clair Ronnie
Home Financials for this Owner
Home Financials are based on the most recent Mortgage that was taken out on this home.
Original Mortgage
$200,000
Outstanding Balance
$126,323
Interest Rate
4.37%
Mortgage Type
Adjustable Rate Mortgage/ARM
Estimated Equity
$134,411
Purchase Details
Closed on
Jun 28, 2004
Sold by
Robert Cantrell Etal
Bought by
Marjorie Jimmie and Marjorie Hoobler
Purchase Details
Closed on
Feb 18, 2004
Sold by
Londa James and Londa Foster
Bought by
Robert Robert R and Robert Cantrell
Purchase Details
Closed on
Oct 31, 1997
Sold by
Troy Pinley Estate
Bought by
Londa James and Londa Foster
Create a Home Valuation Report for This Property
The Home Valuation Report is an in-depth analysis detailing your home's value as well as a comparison with similar homes in the area
Home Values in the Area
Average Home Value in this Area
Purchase History
| Date | Buyer | Sale Price | Title Company |
|---|---|---|---|
| St Clair Denitia E | -- | None Available | |
| St Clair Denitia E | $465,000 | None Available | |
| Marjorie Jimmie | $335,000 | -- | |
| Robert Robert R | $335,000 | -- | |
| Londa James | $92,000 | -- |
Source: Public Records
Mortgage History
| Date | Status | Borrower | Loan Amount |
|---|---|---|---|
| Open | St Clair Denitia E | $200,000 |
Source: Public Records
Tax History Compared to Growth
Tax History
| Year | Tax Paid | Tax Assessment Tax Assessment Total Assessment is a certain percentage of the fair market value that is determined by local assessors to be the total taxable value of land and additions on the property. | Land | Improvement |
|---|---|---|---|---|
| 2024 | $2,790 | $32,305 | $5,411 | $26,894 |
| 2023 | $2,790 | $32,305 | $3,100 | $29,205 |
| 2022 | $2,818 | $32,305 | $3,100 | $29,205 |
| 2021 | $2,856 | $32,305 | $3,100 | $29,205 |
| 2020 | $2,936 | $32,305 | $3,100 | $29,205 |
| 2019 | $3,059 | $32,305 | $3,100 | $29,205 |
| 2018 | $2,848 | $32,305 | $3,100 | $29,205 |
| 2017 | $2,949 | $32,633 | $3,428 | $29,205 |
| 2016 | $2,920 | $32,305 | $3,100 | $29,205 |
| 2015 | $2,704 | $32,380 | $3,096 | $29,284 |
| 2014 | -- | $32,300 | $3,100 | $29,200 |
Source: Public Records
Map
Nearby Homes
- 0 W Hwy 3 Rd W Unit 2527431
- 0 W Hwy 3 Rd W Unit 2527433
- 6207 County Road 1480
- 8300 Oklahoma 3w
- 0 Cr 1479
- 9725 County Road 3470
- 6788 County Road 3470
- 9479 State Highway 3w
- 8880 County Road 3490
- 6910 Oklahoma 3w
- 4045 County Road 1510
- 000 E County Road 1510
- E 149
- 0 Ew 1440 Rd Unit 1177965
- 11065 County Road 1512
- 3525 State Highway 19
- 8615 Oklahoma 19
- 51877 106th St
- 001 Highway 19
- 4979 Oklahoma 3w
- 8197 State Highway 3w
- 3800 State Highway 3 Hwy W
- 6140 County Road 1480
- 7992 State Highway 3w
- 6431 County Road 1480
- 8594 County Road 3460
- 6036 County Road 1480
- 7977 County Road 3460
- 5988 County Road 1479
- 5947 County Road 1480
- 8742 County Road 3460
- 5864 County Road 1480
- 8355 State Highway 3w
- 6500 County Road 1480
- 7966 State Highway 3w
- 5900 County Road 1479
- 5705 County Road 1480
- 8227 County Road 3470
- 8521 County Road 3470
- 8143 County Road 3470