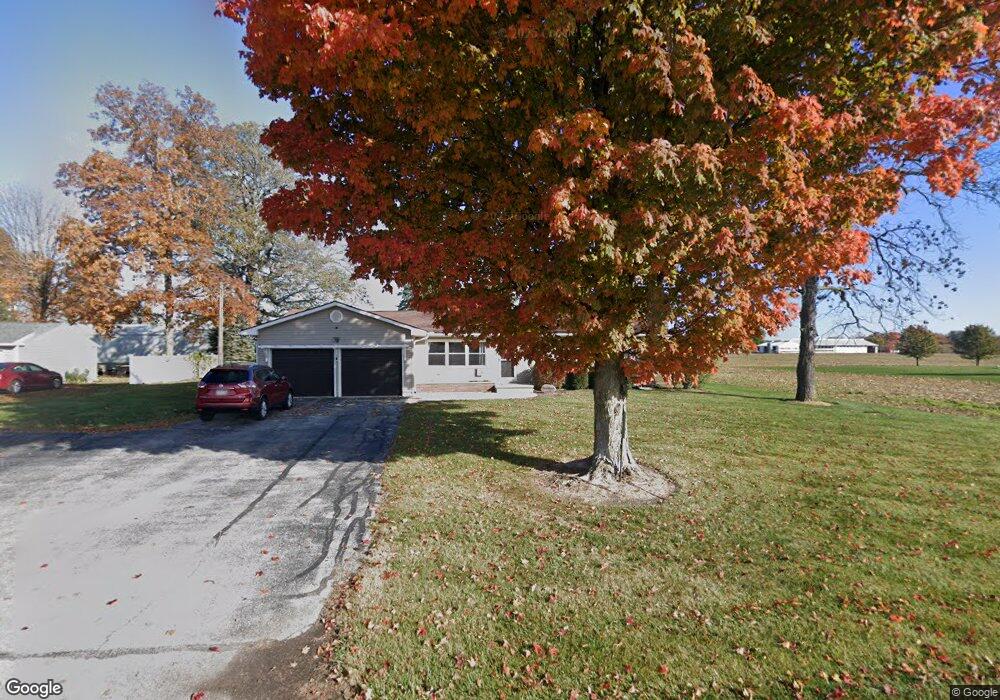
05071 Henschen Rd New Knoxville, OH 45871
Estimated Value: $262,000 - $318,000
3
Beds
1
Bath
1,212
Sq Ft
$242/Sq Ft
Est. Value
About This Home
This home is located at 05071 Henschen Rd, New Knoxville, OH 45871 and is currently estimated at $293,125, approximately $241 per square foot. 05071 Henschen Rd is a home located in Auglaize County with nearby schools including New Knoxville Elementary School.
Ownership History
Date
Name
Owned For
Owner Type
Purchase Details
Closed on
Mar 31, 2022
Sold by
Stienecker Connor R
Bought by
Selby Audrey L and Summers Justin D
Current Estimated Value
Home Financials for this Owner
Home Financials are based on the most recent Mortgage that was taken out on this home.
Original Mortgage
$239,500
Outstanding Balance
$225,936
Interest Rate
4.67%
Mortgage Type
New Conventional
Estimated Equity
$67,189
Purchase Details
Closed on
Sep 16, 2019
Sold by
Fledderjohann Derek R and Fledderjohann Alicia A
Bought by
Stienecker Connor R
Home Financials for this Owner
Home Financials are based on the most recent Mortgage that was taken out on this home.
Original Mortgage
$161,000
Interest Rate
3.5%
Mortgage Type
New Conventional
Purchase Details
Closed on
Mar 5, 2013
Sold by
Fledderjohann Derek R and Fledderjohann Derek
Bought by
Fledderjohann Derek R and Fledderjohann Alicia A
Create a Home Valuation Report for This Property
The Home Valuation Report is an in-depth analysis detailing your home's value as well as a comparison with similar homes in the area
Home Values in the Area
Average Home Value in this Area
Purchase History
| Date | Buyer | Sale Price | Title Company |
|---|---|---|---|
| Selby Audrey L | $247,000 | Schnelle Law Office Llc | |
| Stienecker Connor R | $179,000 | None Available | |
| Fledderjohann Derek R | -- | Attorney |
Source: Public Records
Mortgage History
| Date | Status | Borrower | Loan Amount |
|---|---|---|---|
| Open | Selby Audrey L | $239,500 | |
| Previous Owner | Stienecker Connor R | $161,000 |
Source: Public Records
Tax History Compared to Growth
Tax History
| Year | Tax Paid | Tax Assessment Tax Assessment Total Assessment is a certain percentage of the fair market value that is determined by local assessors to be the total taxable value of land and additions on the property. | Land | Improvement |
|---|---|---|---|---|
| 2024 | $3,469 | $48,990 | $5,870 | $43,120 |
| 2023 | $704 | $48,990 | $5,870 | $43,120 |
| 2022 | $1,423 | $37,780 | $4,890 | $32,890 |
| 2021 | $1,404 | $37,780 | $4,890 | $32,890 |
| 2020 | $714 | $37,780 | $4,890 | $32,890 |
| 2019 | $1,195 | $31,528 | $4,074 | $27,454 |
| 2018 | $1,196 | $31,528 | $4,074 | $27,454 |
| 2017 | $1,198 | $31,528 | $4,074 | $27,454 |
| 2016 | $1,113 | $29,838 | $3,882 | $25,956 |
| 2015 | $1,085 | $29,838 | $3,882 | $25,956 |
| 2014 | $1,086 | $29,838 | $3,882 | $25,956 |
| 2013 | $1,272 | $29,838 | $3,882 | $25,956 |
Source: Public Records
Map
Nearby Homes
- 107 S Mill St
- 101 Saxony Dr
- 103 Saxony Dr
- 0 Schwieterman Unit 4 290334
- 0 Schwieterman Unit 8 290342
- 0 Schwieterman Unit 10 290345
- 0 Schwieterman Unit 11 290346
- 0 Schwieterman Unit 1 290329
- 0 Schwieterman Unit 9 290344
- 0 Schwieterman Unit 7 290341
- 0 Schwieterman Unit 12 290347
- 0 Schwieterman Unit 13 290348
- 0 Saxony Unit 1032555
- 437 Woodward St
- 0 S Beech St
- 508 Webb St
- 602 Weston St
- 408 S Vine St
- 403 S Vine St
- 116 Meadowbrook Ln
- 5071 Henschen Rd
- 5051 Henschen Rd
- 05051 Henschen Rd
- 05051 Henschen Rd
- 05105 Henschen Rd
- 9784 Plattner Rd
- 09784 Plattner Rd
- 09818 Plattner Rd
- 09842 Plattner Rd
- 09882 Plattner Rd
- 05208 State Route 219
- 05300 Henschen Rd
- 5325 State Route 219
- 05480 State Route 219
- 5480 Ohio 219
- 4692 Ohio 219
- 05477 State Route 219
- 05633 State Route 219
- 05679 State Route 219
- 5679 Ohio 219