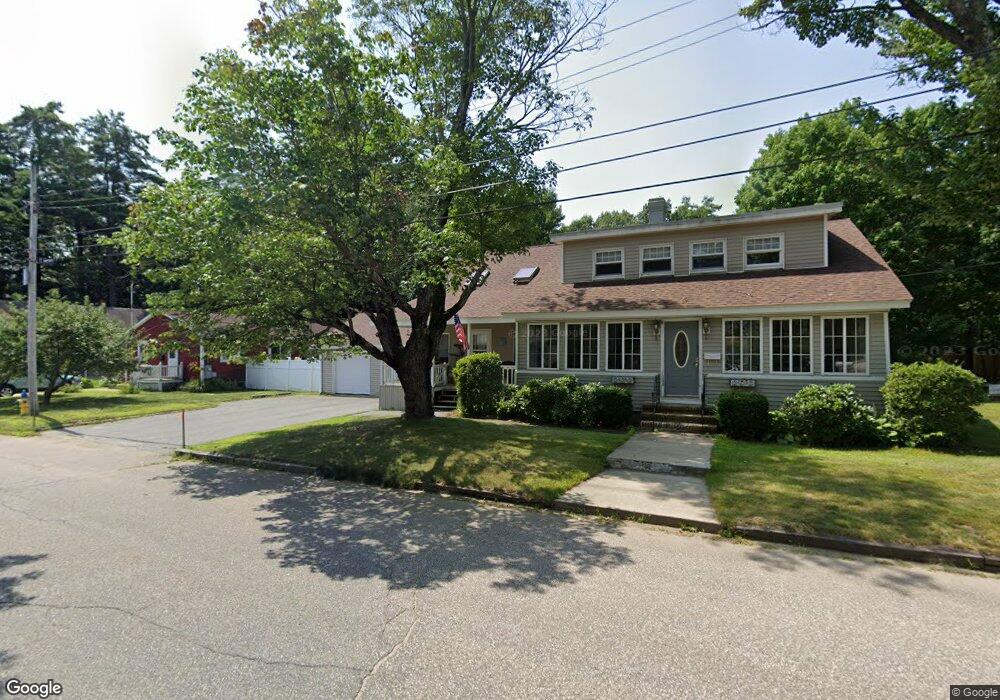
09 New Hampshire St Sanford, ME 04073
Estimated Value: $380,000 - $474,000
6
Beds
3
Baths
2,325
Sq Ft
$180/Sq Ft
Est. Value
About This Home
This home is located at 09 New Hampshire St, Sanford, ME 04073 and is currently estimated at $419,574, approximately $180 per square foot. 09 New Hampshire St is a home located in York County with nearby schools including Sanford Christian Academy and St Thomas Consolidated School.
Ownership History
Date
Name
Owned For
Owner Type
Purchase Details
Closed on
Feb 9, 2010
Sold by
Ondaur Capital Corp
Bought by
Venne Mark K and Venne Susan M
Current Estimated Value
Home Financials for this Owner
Home Financials are based on the most recent Mortgage that was taken out on this home.
Original Mortgage
$183,870
Outstanding Balance
$121,813
Interest Rate
5.05%
Mortgage Type
FHA
Estimated Equity
$297,761
Purchase Details
Closed on
May 11, 2009
Sold by
Saxon Mortgage Svcs Inc
Bought by
Kondaur Capital Corp
Purchase Details
Closed on
Nov 10, 2005
Sold by
Hillcock Juliane and Hillcock Keith E
Bought by
Nolette Nancy and Nolette Robert
Home Financials for this Owner
Home Financials are based on the most recent Mortgage that was taken out on this home.
Original Mortgage
$202,000
Interest Rate
5.93%
Mortgage Type
Purchase Money Mortgage
Create a Home Valuation Report for This Property
The Home Valuation Report is an in-depth analysis detailing your home's value as well as a comparison with similar homes in the area
Home Values in the Area
Average Home Value in this Area
Purchase History
| Date | Buyer | Sale Price | Title Company |
|---|---|---|---|
| Venne Mark K | -- | -- | |
| Kondaur Capital Corp | -- | -- | |
| Nolette Nancy | -- | -- |
Source: Public Records
Mortgage History
| Date | Status | Borrower | Loan Amount |
|---|---|---|---|
| Open | Kondaur Capital Corp | $183,870 | |
| Previous Owner | Nolette Nancy | $202,000 |
Source: Public Records
Tax History Compared to Growth
Tax History
| Year | Tax Paid | Tax Assessment Tax Assessment Total Assessment is a certain percentage of the fair market value that is determined by local assessors to be the total taxable value of land and additions on the property. | Land | Improvement |
|---|---|---|---|---|
| 2024 | $5,011 | $310,500 | $38,000 | $272,500 |
| 2023 | $4,662 | $307,900 | $38,000 | $269,900 |
| 2022 | $4,557 | $307,900 | $38,000 | $269,900 |
| 2021 | $4,490 | $247,000 | $38,000 | $209,000 |
| 2020 | $4,250 | $210,800 | $38,000 | $172,800 |
| 2019 | $4,057 | $196,000 | $38,000 | $158,000 |
| 2018 | $3,850 | $187,800 | $38,000 | $149,800 |
| 2017 | $3,690 | $177,900 | $38,000 | $139,900 |
| 2016 | $3,727 | $163,900 | $38,000 | $125,900 |
| 2015 | $3,694 | $167,600 | $38,500 | $129,100 |
| 2014 | $3,624 | $167,600 | $38,500 | $129,100 |
| 2013 | -- | $167,600 | $38,500 | $129,100 |
Source: Public Records
Map
Nearby Homes
- 1023 Main St
- 0 Main St Unit 1610912
- 25 Pearl St
- 58 Essex St
- 54 Malcolm Ave
- 4 Raymond St
- 1110 Main St
- 6 Hewey St
- 49 School St
- 13 Timothy Ln
- 126 Jackson St
- 40 School St
- 1 Kempton Terrace
- 9 Dale St
- 15 Running Brook Dr
- 19 Bodwell St Unit 9
- 19 Bodwell St Unit 8
- 19 Bodwell St Unit 7
- 19 Bodwell St Unit 6
- 19 Bodwell St Unit 5