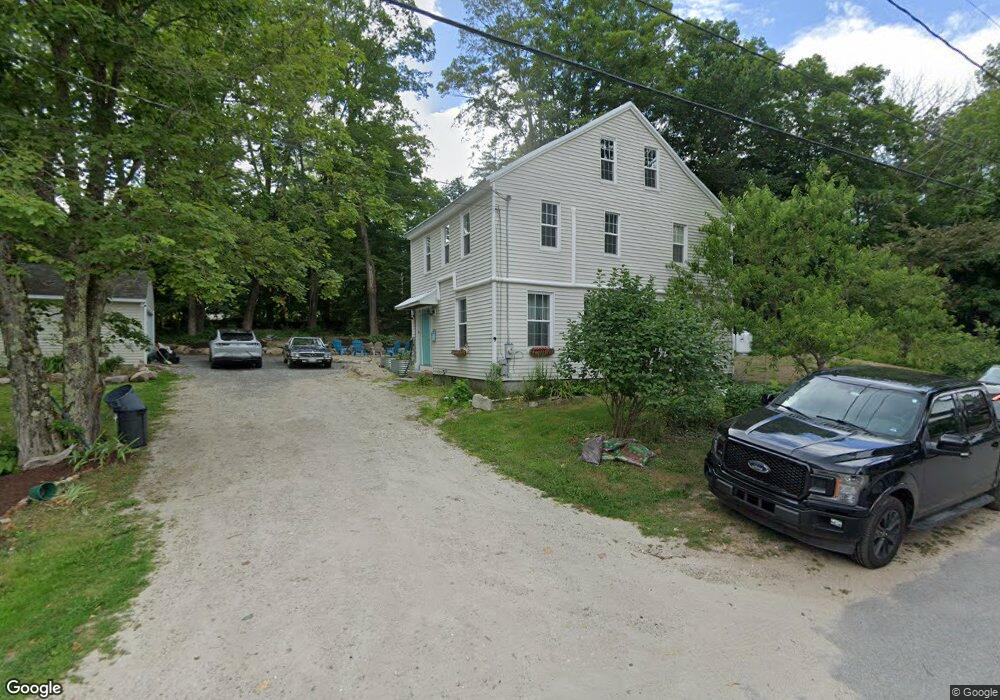
09 Walker St Bridgton, ME 04009
Estimated Value: $220,000 - $308,962
3
Beds
1
Bath
660
Sq Ft
$403/Sq Ft
Est. Value
About This Home
This home is located at 09 Walker St, Bridgton, ME 04009 and is currently estimated at $265,991, approximately $403 per square foot. 09 Walker St is a home located in Cumberland County with nearby schools including Lake Region High School and Bridgton Academy.
Ownership History
Date
Name
Owned For
Owner Type
Purchase Details
Closed on
Nov 29, 2021
Sold by
Sheehan Anne M
Bought by
Bradstreet William H and Bradstreet Christine
Current Estimated Value
Purchase Details
Closed on
Mar 26, 2010
Sold by
Farr Eric
Bought by
Deutsche Bank Natl T Co
Purchase Details
Closed on
May 11, 2005
Sold by
Tenczar Julie A and Burrows Julie A
Bought by
Farr Eric and Farr Kathryn
Home Financials for this Owner
Home Financials are based on the most recent Mortgage that was taken out on this home.
Original Mortgage
$94,000
Interest Rate
8%
Mortgage Type
Commercial
Create a Home Valuation Report for This Property
The Home Valuation Report is an in-depth analysis detailing your home's value as well as a comparison with similar homes in the area
Home Values in the Area
Average Home Value in this Area
Purchase History
| Date | Buyer | Sale Price | Title Company |
|---|---|---|---|
| Bradstreet William H | -- | None Available | |
| Deutsche Bank Natl T Co | -- | -- | |
| Farr Eric | -- | -- |
Source: Public Records
Mortgage History
| Date | Status | Borrower | Loan Amount |
|---|---|---|---|
| Previous Owner | Farr Eric | $94,000 | |
| Previous Owner | Farr Eric | $23,500 |
Source: Public Records
Tax History Compared to Growth
Tax History
| Year | Tax Paid | Tax Assessment Tax Assessment Total Assessment is a certain percentage of the fair market value that is determined by local assessors to be the total taxable value of land and additions on the property. | Land | Improvement |
|---|---|---|---|---|
| 2024 | $2,405 | $141,084 | $27,192 | $113,892 |
| 2023 | $2,042 | $118,692 | $27,192 | $91,500 |
| 2022 | $1,804 | $118,692 | $27,192 | $91,500 |
| 2021 | $1,757 | $118,692 | $27,192 | $91,500 |
| 2020 | $1,774 | $118,692 | $27,192 | $91,500 |
| 2019 | $1,780 | $118,692 | $27,192 | $91,500 |
| 2018 | $1,757 | $118,692 | $27,192 | $91,500 |
| 2017 | $1,816 | $118,692 | $27,192 | $91,500 |
| 2016 | $1,763 | $118,692 | $27,192 | $91,500 |
| 2015 | $1,542 | $112,158 | $34,069 | $78,089 |
| 2014 | $1,510 | $107,407 | $34,069 | $73,338 |
Source: Public Records
Map
Nearby Homes
- 3 Fowler St
- 20 Bennett St
- 6 School St
- 10 Gallinari Way
- 0 Tuttle Ln Unit 1628227
- 220 S High St
- 7 Memory Ln
- 222 N High St
- 4 C St
- 3 A St
- 209 Portland Rd
- 11 Sweden Rd
- 236 Portland Rd Unit A
- 70 Plummers Landing Rd
- 7 Elysian Way
- Lot 23 G Smally Way
- Lot 23 - F Smally Way
- Lot 23 - D Smally Way
- 26 Middle Ridge Rd
- 34 Middle Ridge Rd