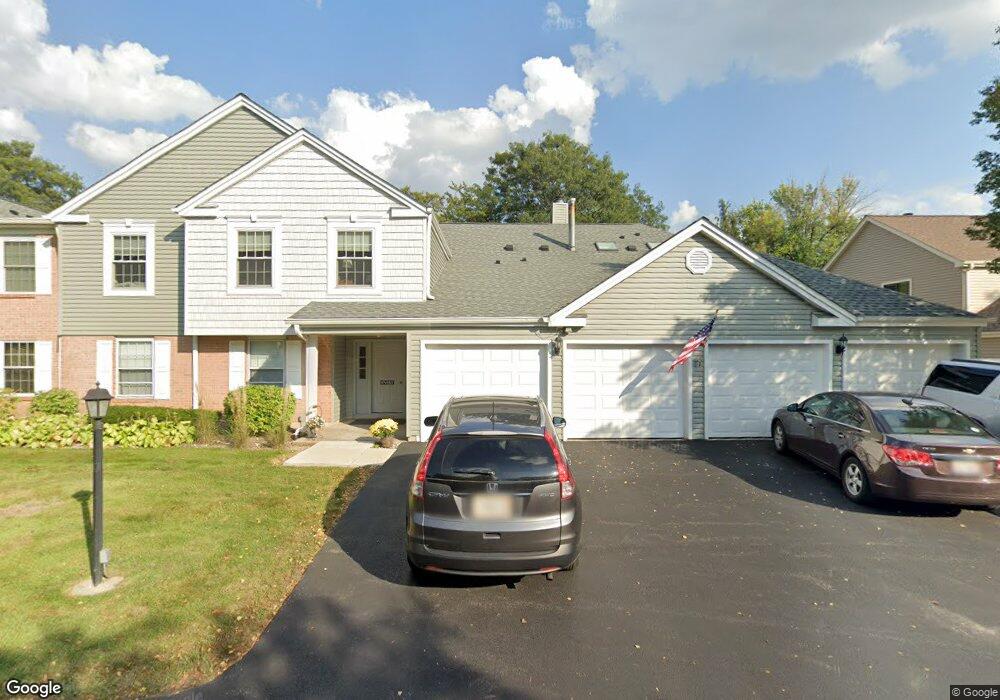
0N065 Coniston Ct Unit 704 Winfield, IL 60190
Estimated Value: $232,000 - $279,000
2
Beds
2
Baths
1,030
Sq Ft
$251/Sq Ft
Est. Value
About This Home
This home is located at 0N065 Coniston Ct Unit 704, Winfield, IL 60190 and is currently estimated at $258,196, approximately $250 per square foot. 0N065 Coniston Ct Unit 704 is a home located in DuPage County with nearby schools including Winfield Central School, Winfield Primary School, and West Chicago Community High School.
Ownership History
Date
Name
Owned For
Owner Type
Purchase Details
Closed on
May 8, 2017
Sold by
Huse Coleen and Wilkinson Donna M
Bought by
Tirjer Robert and Tirjer Nancy
Current Estimated Value
Home Financials for this Owner
Home Financials are based on the most recent Mortgage that was taken out on this home.
Original Mortgage
$101,250
Outstanding Balance
$83,665
Interest Rate
3.87%
Mortgage Type
New Conventional
Estimated Equity
$174,531
Purchase Details
Closed on
Jun 5, 2002
Sold by
Wilkinson Claire
Bought by
Wilkinson Claire T and Claire T Wilkinson Trust
Purchase Details
Closed on
Apr 8, 2002
Sold by
Sulkson Allison E and Frey Allison E
Bought by
Wilkinson Claire
Purchase Details
Closed on
Nov 19, 1999
Sold by
Faydash Ingrid M Larson
Bought by
Frey Allison E
Home Financials for this Owner
Home Financials are based on the most recent Mortgage that was taken out on this home.
Original Mortgage
$101,520
Interest Rate
7.97%
Mortgage Type
Balloon
Create a Home Valuation Report for This Property
The Home Valuation Report is an in-depth analysis detailing your home's value as well as a comparison with similar homes in the area
Home Values in the Area
Average Home Value in this Area
Purchase History
| Date | Buyer | Sale Price | Title Company |
|---|---|---|---|
| Tirjer Robert | $135,000 | None Available | |
| Wilkinson Claire T | -- | -- | |
| Wilkinson Claire | $135,000 | -- | |
| Frey Allison E | $113,000 | First American Title Ins |
Source: Public Records
Mortgage History
| Date | Status | Borrower | Loan Amount |
|---|---|---|---|
| Open | Tirjer Robert | $101,250 | |
| Previous Owner | Frey Allison E | $101,520 |
Source: Public Records
Tax History Compared to Growth
Tax History
| Year | Tax Paid | Tax Assessment Tax Assessment Total Assessment is a certain percentage of the fair market value that is determined by local assessors to be the total taxable value of land and additions on the property. | Land | Improvement |
|---|---|---|---|---|
| 2024 | -- | $71,180 | $14,037 | $57,143 |
| 2023 | $3,011 | $65,010 | $12,820 | $52,190 |
| 2022 | $3,011 | $60,760 | $11,990 | $48,770 |
| 2021 | $2,962 | $58,240 | $11,490 | $46,750 |
| 2020 | $3,007 | $56,470 | $11,140 | $45,330 |
| 2019 | $3,144 | $53,780 | $10,610 | $43,170 |
| 2018 | $3,828 | $51,710 | $10,200 | $41,510 |
| 2017 | $3,285 | $49,130 | $9,690 | $39,440 |
| 2016 | $3,144 | $45,800 | $9,030 | $36,770 |
| 2015 | $3,025 | $42,400 | $8,360 | $34,040 |
| 2014 | $2,975 | $41,090 | $8,110 | $32,980 |
| 2013 | $3,275 | $45,970 | $8,410 | $37,560 |
Source: Public Records
Map
Nearby Homes
- 0N069 Windermere Rd Unit 2301
- 0N200 Windermere Rd Unit 2702
- 27W705 Grasmere Dr Unit 1705
- 28W061 Woodland Dr
- 28W068 Shelburne Farms Dr
- Lot #69 Winfield Rd
- 0N062 Forsythe Ct
- 0N082 Forsythe Ct
- 0S619 Forest Ave
- 27W773 Beecher Ave
- 0S044 Lee Ct
- 27W375 Oakwood St
- 3 Sunnyside Ave
- 27W423 Sunnyside Ave
- 27W180 Cooley Ave
- 27W250 Birch St
- 27W277 Waterford Dr
- 26W537 Barnes Ave
- 28W605 Barnes Ave
- 28W185 Geneva Rd
- 0N120 Ennerdale Ln Unit 1506
- 0N073 Windermere Rd Unit 2201
- 0N128 Ennerdale Ln Unit 1401
- 0N115 Coniston Ct Unit 903
- 0N115 Coniston Ct Unit 908
- 0N033 Coniston Ct Unit 504
- 0N073 Windermere Rd Unit 2202
- 0N065 Windermere Rd Unit 2307
- 0N115 Coniston Ct
- 0N065 Windermere Rd Unit 2303
- 0N212 Windermere Rd Unit 2804
- 0N120 Ennerdale Ln Unit 1502
- 0N212 Windermere Rd Unit 2807
- 0N111 Coniston Ct Unit 801
- 0N116 Ennerdale Ln Unit 1608
- 0N178 Windermere Rd
- 0N037 Coniston Ct Unit 506
- 0N033 Coniston Ct Unit 508
- 0N073 Windermere Rd Unit 2205
- 0N128 Ennerdale Ln