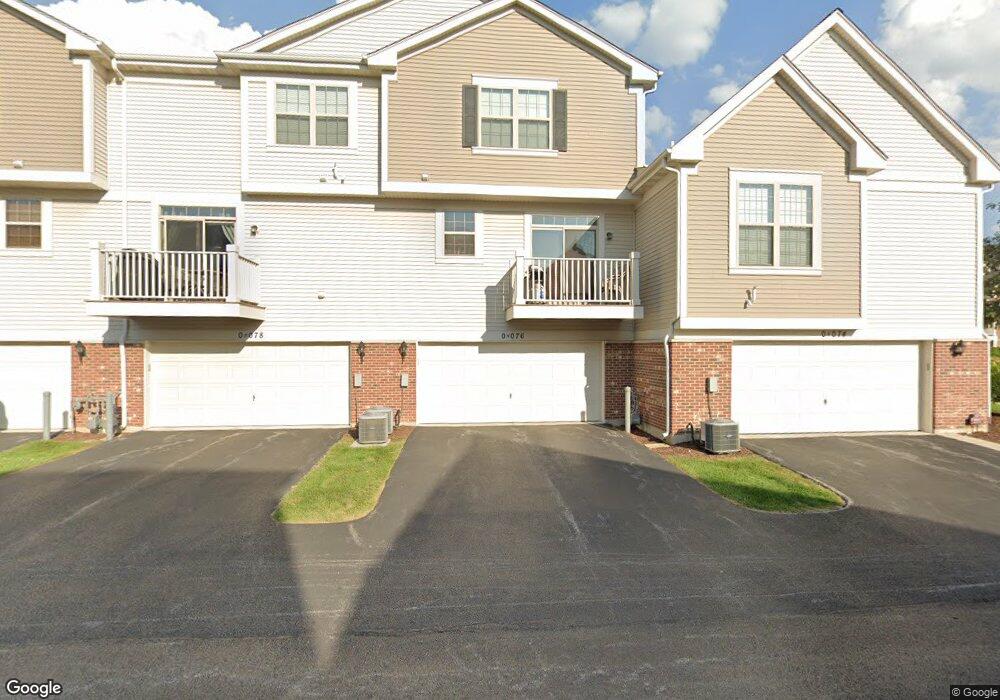
0N093 Vermont Ct Winfield, IL 60190
Estimated Value: $367,000 - $416,000
2
Beds
3
Baths
1,910
Sq Ft
$206/Sq Ft
Est. Value
About This Home
This home is located at 0N093 Vermont Ct, Winfield, IL 60190 and is currently estimated at $394,001, approximately $206 per square foot. 0N093 Vermont Ct is a home located in DuPage County with nearby schools including Winfield Central School, Winfield Primary School, and West Chicago Community High School.
Ownership History
Date
Name
Owned For
Owner Type
Purchase Details
Closed on
Jun 29, 2011
Sold by
M/I Homes Of Chicago Llc
Bought by
Panger Sam
Current Estimated Value
Home Financials for this Owner
Home Financials are based on the most recent Mortgage that was taken out on this home.
Original Mortgage
$155,950
Outstanding Balance
$107,895
Interest Rate
4.63%
Mortgage Type
New Conventional
Estimated Equity
$286,106
Create a Home Valuation Report for This Property
The Home Valuation Report is an in-depth analysis detailing your home's value as well as a comparison with similar homes in the area
Home Values in the Area
Average Home Value in this Area
Purchase History
| Date | Buyer | Sale Price | Title Company |
|---|---|---|---|
| Panger Sam | $226,000 | First American Title Ins Co |
Source: Public Records
Mortgage History
| Date | Status | Borrower | Loan Amount |
|---|---|---|---|
| Open | Panger Sam | $155,950 |
Source: Public Records
Tax History Compared to Growth
Tax History
| Year | Tax Paid | Tax Assessment Tax Assessment Total Assessment is a certain percentage of the fair market value that is determined by local assessors to be the total taxable value of land and additions on the property. | Land | Improvement |
|---|---|---|---|---|
| 2024 | $6,735 | $105,723 | $32,190 | $73,533 |
| 2023 | $6,366 | $96,560 | $29,400 | $67,160 |
| 2022 | $6,245 | $90,250 | $27,480 | $62,770 |
| 2021 | $5,854 | $86,510 | $26,340 | $60,170 |
| 2020 | $5,736 | $83,880 | $25,540 | $58,340 |
| 2019 | $5,667 | $79,880 | $24,320 | $55,560 |
| 2018 | $5,390 | $75,360 | $22,940 | $52,420 |
| 2017 | $4,974 | $63,730 | $21,790 | $41,940 |
| 2016 | $4,826 | $59,420 | $20,320 | $39,100 |
| 2015 | $4,721 | $55,000 | $18,810 | $36,190 |
| 2014 | $4,489 | $51,400 | $17,580 | $33,820 |
| 2013 | $4,428 | $53,280 | $18,220 | $35,060 |
Source: Public Records
Map
Nearby Homes
- 0N082 Forsythe Ct
- 0N062 Forsythe Ct
- 28W068 Shelburne Farms Dr
- 28W061 Woodland Dr
- 27W705 Grasmere Dr Unit 1705
- 0N200 Windermere Rd Unit 2702
- 0N069 Windermere Rd Unit 2301
- 27W773 Beecher Ave
- 27W375 Oakwood St
- Lot #69 Winfield Rd
- 28W185 Geneva Rd
- 0S619 Forest Ave
- 34 S Lake Dr
- 0S044 Lee Ct
- 28W605 Barnes Ave
- 27W250 Birch St
- 28W659 Lester St
- 27W277 Waterford Dr
- 3 Sunnyside Ave
- 27W423 Sunnyside Ave
- 0N091 Vermont Ct
- 0N095 Vermont Ct
- N089 Vermont Ct
- 0N097 Vermont Ct
- n 089 Vermont Ct
- 0N087 Vermont Ct
- 0N092 Woodland Ct
- 0N090 Woodland Ct
- 0N094 Woodland Ct
- 0N092 Vermont Ct
- 0N092 Vermont Ct
- 0N090 Vermont Ct
- 0N094 Vermont Ct
- 0N088 Woodland Ct
- 0N096 Vermont Ct Unit 3
- 0N085 Vermont Ct
- 0N088 Vermont Ct
- 0N096 Woodland Ct
- 0N086 Woodland Ct
- 0N086 Vermont Ct