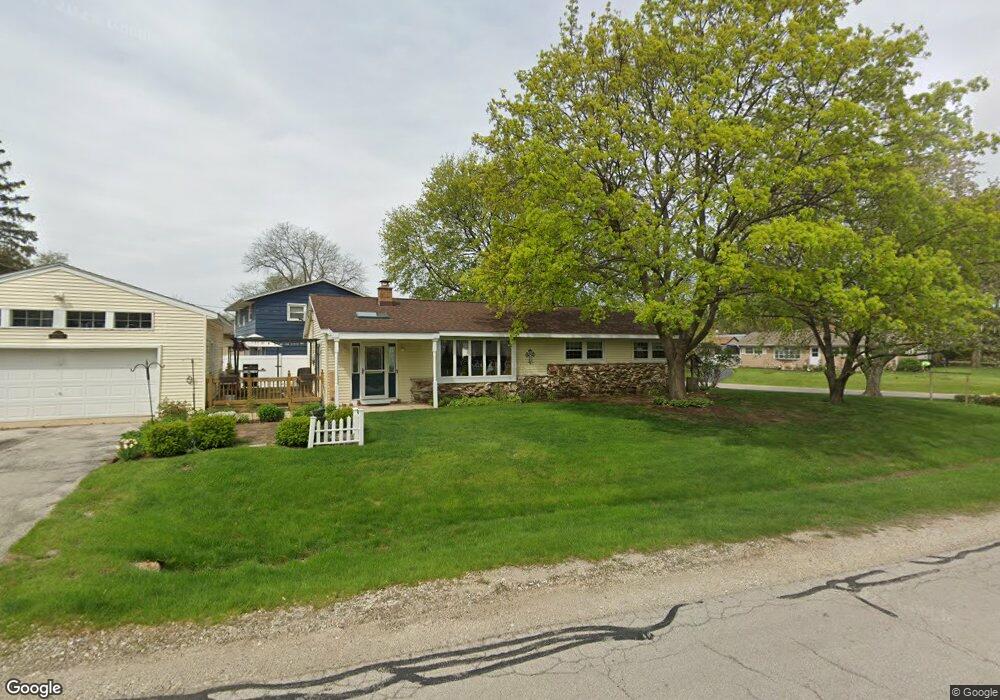
0N100 Page St Winfield, IL 60190
Jewell Road NeighborhoodEstimated Value: $324,000 - $420,000
3
Beds
1
Bath
1,456
Sq Ft
$243/Sq Ft
Est. Value
About This Home
This home is located at 0N100 Page St, Winfield, IL 60190 and is currently estimated at $353,802, approximately $242 per square foot. 0N100 Page St is a home with nearby schools including Carl Sandburg Elementary School, Monroe Middle School, and Wheaton North High School.
Ownership History
Date
Name
Owned For
Owner Type
Purchase Details
Closed on
Aug 28, 2001
Sold by
Rodgers Christopher M
Bought by
Rodgers Christopher M and Rodgers Fiona
Current Estimated Value
Home Financials for this Owner
Home Financials are based on the most recent Mortgage that was taken out on this home.
Original Mortgage
$158,000
Outstanding Balance
$71,182
Interest Rate
9.15%
Estimated Equity
$282,620
Purchase Details
Closed on
May 31, 2000
Sold by
Uhal Bruce D and Uhal Janet F
Bought by
Rodgers Christopher M
Home Financials for this Owner
Home Financials are based on the most recent Mortgage that was taken out on this home.
Original Mortgage
$145,000
Interest Rate
11.45%
Purchase Details
Closed on
Oct 12, 1993
Sold by
Dumper Donald B and Dumper Gail M
Bought by
Uhal Bruce D and Uhal Janet F
Home Financials for this Owner
Home Financials are based on the most recent Mortgage that was taken out on this home.
Original Mortgage
$118,650
Interest Rate
7%
Mortgage Type
FHA
Create a Home Valuation Report for This Property
The Home Valuation Report is an in-depth analysis detailing your home's value as well as a comparison with similar homes in the area
Home Values in the Area
Average Home Value in this Area
Purchase History
| Date | Buyer | Sale Price | Title Company |
|---|---|---|---|
| Rodgers Christopher M | -- | -- | |
| Rodgers Christopher M | $147,000 | Burnet Title Llc | |
| Uhal Bruce D | $119,000 | -- |
Source: Public Records
Mortgage History
| Date | Status | Borrower | Loan Amount |
|---|---|---|---|
| Open | Rodgers Christopher M | $158,000 | |
| Closed | Rodgers Christopher M | $145,000 | |
| Previous Owner | Uhal Bruce D | $118,650 |
Source: Public Records
Tax History Compared to Growth
Tax History
| Year | Tax Paid | Tax Assessment Tax Assessment Total Assessment is a certain percentage of the fair market value that is determined by local assessors to be the total taxable value of land and additions on the property. | Land | Improvement |
|---|---|---|---|---|
| 2024 | $5,173 | $90,573 | $18,816 | $71,757 |
| 2023 | $4,934 | $83,370 | $17,320 | $66,050 |
| 2022 | $4,853 | $78,790 | $16,370 | $62,420 |
| 2021 | $4,684 | $76,920 | $15,980 | $60,940 |
| 2020 | $4,659 | $76,200 | $15,830 | $60,370 |
| 2019 | $4,536 | $74,190 | $15,410 | $58,780 |
| 2018 | $4,277 | $69,700 | $14,520 | $55,180 |
| 2017 | $4,199 | $67,120 | $13,980 | $53,140 |
| 2016 | $4,134 | $64,440 | $13,420 | $51,020 |
| 2015 | $4,095 | $61,470 | $12,800 | $48,670 |
| 2014 | $4,462 | $65,350 | $12,870 | $52,480 |
| 2013 | $4,326 | $65,550 | $12,910 | $52,640 |
Source: Public Records
Map
Nearby Homes
- 26W278 Harrison Ave
- 26W447 Harrison Ave
- S071 Leonard St
- 26W537 Barnes Ave
- 0S064 Calvin Ct
- S045 Pleasant Hill Rd
- 27W180 Cooley Ave
- 26W181 Grand Ave
- 200 N Erie St
- 27W250 Birch St
- 0S044 Lee Ct
- 26W185 Meadowview Ct
- 1230 Champion Forest Ct
- 1206 Wheaton Oaks Dr Unit D
- 27W375 Oakwood St
- 0S619 Forest Ave
- 1149 Wheaton Oaks Dr
- 27W277 Waterford Dr
- 1N027 Ethel St
- 119 N Dorchester Ave
- 26W365 Prairie Ave
- Lot 19 Page St
- 26W369 Prairie Ave
- 0N072 Page St
- 0N111 Page St
- 26W375 Prairie Ave
- S055 Page St
- N035 Page St
- 26W370 Prairie Ave
- 0N083 Page St
- 0N079 Page St
- 0N064 Page St
- 26W339 Prairie Ave
- 0N071 Page St
- 0N075 Leonard St
- 0N122 Page St
- 0N107 Leonard St
- 0N054 Page St
- 0N065 Page St
- 0N065 Leonard St