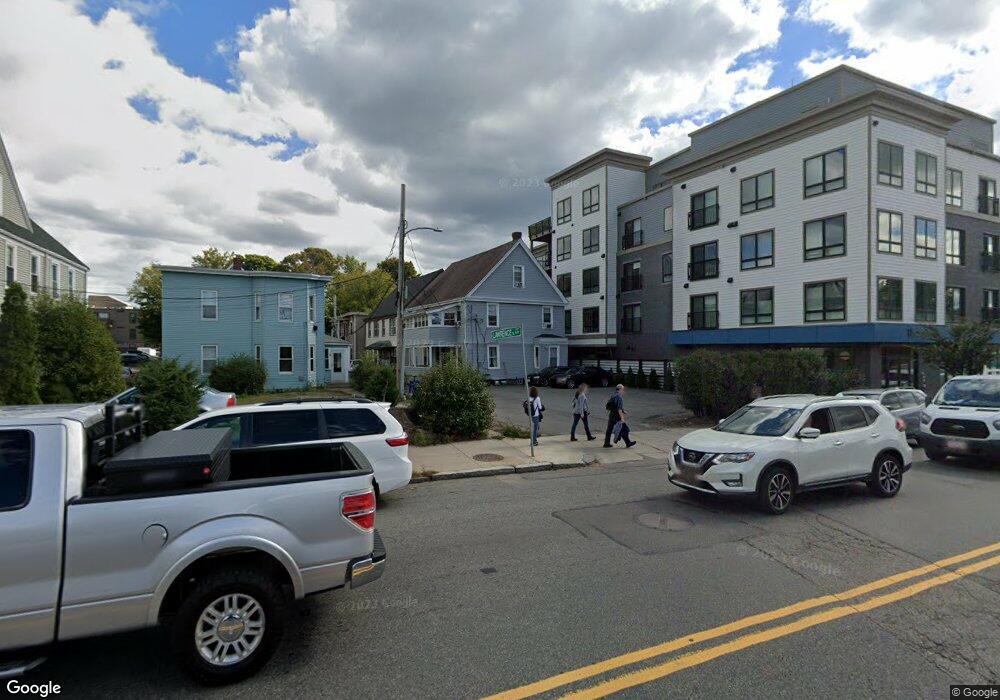
1-3 Lawrence Place Brighton, MA 02135
Brighton NeighborhoodEstimated Value: $1,192,000 - $1,387,000
11
Beds
3
Baths
2,365
Sq Ft
$538/Sq Ft
Est. Value
About This Home
This home is located at 1-3 Lawrence Place, Brighton, MA 02135 and is currently estimated at $1,271,772, approximately $537 per square foot. 1-3 Lawrence Place is a home located in Suffolk County with nearby schools including Boston Green Academy Horace Mann Charter School, St Columbkille Partnership School, and Shaloh House Jewish Day School.
Ownership History
Date
Name
Owned For
Owner Type
Purchase Details
Closed on
Jul 7, 2021
Sold by
Wrong Rt and Argiros
Bought by
Argiros Michael A
Current Estimated Value
Home Financials for this Owner
Home Financials are based on the most recent Mortgage that was taken out on this home.
Original Mortgage
$937,500
Outstanding Balance
$859,563
Interest Rate
3.75%
Mortgage Type
Adjustable Rate Mortgage/ARM
Estimated Equity
$412,209
Purchase Details
Closed on
May 12, 2004
Sold by
Silva Wanessa and Silva Lindelson G
Bought by
Argiros Tr Michael A and Maguire Frank
Home Financials for this Owner
Home Financials are based on the most recent Mortgage that was taken out on this home.
Original Mortgage
$584,000
Interest Rate
5.47%
Mortgage Type
Purchase Money Mortgage
Create a Home Valuation Report for This Property
The Home Valuation Report is an in-depth analysis detailing your home's value as well as a comparison with similar homes in the area
Home Values in the Area
Average Home Value in this Area
Purchase History
| Date | Buyer | Sale Price | Title Company |
|---|---|---|---|
| Argiros Michael A | -- | None Available | |
| Argiros Michael A | -- | None Available | |
| Argiros Michael A | -- | None Available | |
| Argiros Tr Michael A | $730,000 | -- | |
| Argiros Tr Michael A | $730,000 | -- |
Source: Public Records
Mortgage History
| Date | Status | Borrower | Loan Amount |
|---|---|---|---|
| Open | Argiros Michael A | $937,500 | |
| Closed | Argiros Michael A | $937,500 | |
| Previous Owner | Argiros Tr Michael A | $584,000 | |
| Previous Owner | Argiros Tr Michael A | $384,900 |
Source: Public Records
Tax History Compared to Growth
Tax History
| Year | Tax Paid | Tax Assessment Tax Assessment Total Assessment is a certain percentage of the fair market value that is determined by local assessors to be the total taxable value of land and additions on the property. | Land | Improvement |
|---|---|---|---|---|
| 2025 | $12,603 | $1,088,300 | $310,600 | $777,700 |
| 2024 | $11,918 | $1,093,400 | $296,100 | $797,300 |
| 2023 | $11,743 | $1,093,400 | $296,100 | $797,300 |
| 2022 | $11,113 | $1,021,400 | $276,600 | $744,800 |
| 2021 | $10,380 | $972,800 | $263,400 | $709,400 |
| 2020 | $9,698 | $918,400 | $231,800 | $686,600 |
| 2019 | $9,216 | $874,400 | $182,100 | $692,300 |
| 2018 | $8,484 | $809,500 | $182,100 | $627,400 |
| 2017 | $8,404 | $793,600 | $182,100 | $611,500 |
| 2016 | $7,937 | $721,500 | $182,100 | $539,400 |
| 2015 | $6,816 | $562,800 | $190,800 | $372,000 |
| 2014 | $6,154 | $489,200 | $190,800 | $298,400 |
Source: Public Records
Map
Nearby Homes
- 212 Market St Unit 201
- 200-202 Market St
- 11 Faneuil St
- 32 Cushman Rd
- 87 Etna St
- 84-86 Etna St
- 58 Dustin St Unit 1
- 70 Leo Birmingham Pkwy Unit 307
- 50 Hichborn St Unit 101
- 6 Harriet St
- 50 Leo M Birmingham Pkwy Unit 605
- 50 Leo M Birmingham Pkwy Unit 303
- 50 Leo M Birmingham Pkwy Unit 603
- 50 Leo M Birmingham Pkwy Unit 501
- 14 Converse St
- 100 Lincoln St Unit 302
- 100 Lincoln St Unit 203
- 100 Lincoln St Unit 207
- 100 Lincoln St Unit 307
- 100 Lincoln St Unit 208
- 1 Lawrence Place Unit 1
- 3 Lawrence Place
- 3 Lawrence Place Unit 3
- 13 Lawrence Place
- 5 Lawrence Place Unit 1
- 57 Lawrence Place
- 24 Lawrence Place
- 206 S Market St Unit ID1051209P
- 2-4 Lawrence Place
- 2 Lawrence Place
- 214 Market St Unit 3
- 214 Market St
- 214 Market St
- 214 Market St Unit 6
- 214 Market St Unit 202
- 214 Market St Unit 401
- 214 Market St Unit 501
- 214 Market St Unit 402
- 214 Market St Unit 208
- 214 Market St Unit 302