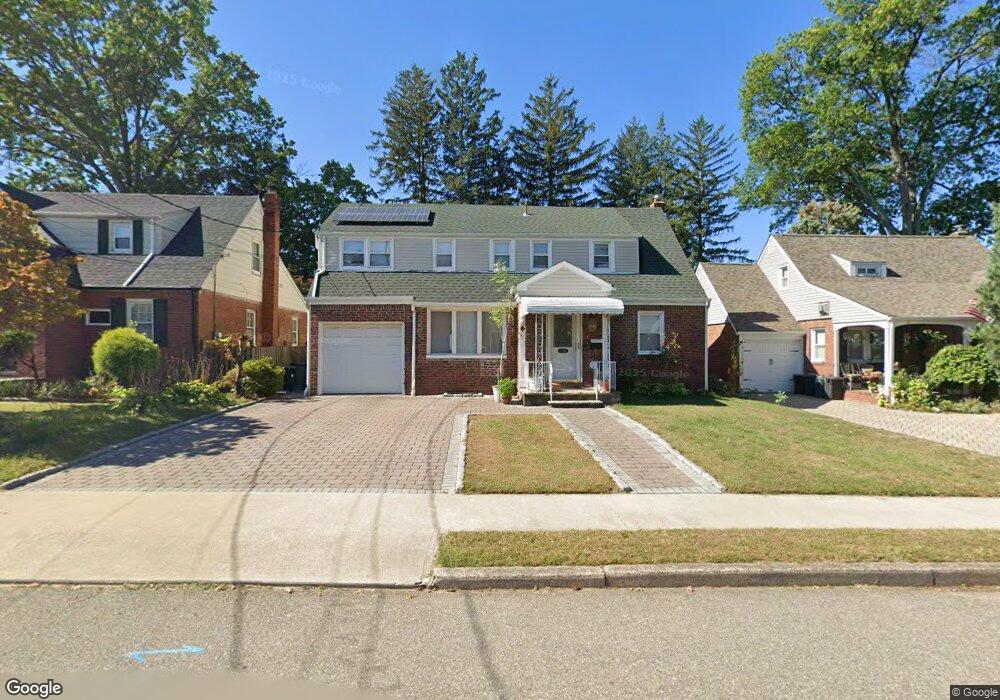
1-34 35th St Fair Lawn, NJ 07410
Estimated Value: $687,727 - $807,000
--
Bed
--
Bath
1,765
Sq Ft
$419/Sq Ft
Est. Value
About This Home
This home is located at 1-34 35th St, Fair Lawn, NJ 07410 and is currently estimated at $739,932, approximately $419 per square foot. 1-34 35th St is a home located in Bergen County with nearby schools including Warren Point Elementary School, Thomas Jefferson Middle School, and Fair Lawn High School.
Ownership History
Date
Name
Owned For
Owner Type
Purchase Details
Closed on
Mar 28, 2008
Sold by
Butka Gina and Grater Anthony
Bought by
Patel Biren and Patel Nilam
Current Estimated Value
Home Financials for this Owner
Home Financials are based on the most recent Mortgage that was taken out on this home.
Original Mortgage
$352,000
Outstanding Balance
$224,022
Interest Rate
6.06%
Mortgage Type
New Conventional
Estimated Equity
$515,910
Purchase Details
Closed on
Jul 29, 2005
Sold by
Ascolese Eugene
Bought by
Butka Gina and Butka Barbara
Home Financials for this Owner
Home Financials are based on the most recent Mortgage that was taken out on this home.
Original Mortgage
$348,000
Interest Rate
5.68%
Purchase Details
Closed on
Aug 31, 2004
Sold by
Geiger Joan
Bought by
Ascolese Eugene
Home Financials for this Owner
Home Financials are based on the most recent Mortgage that was taken out on this home.
Original Mortgage
$280,250
Interest Rate
5.89%
Create a Home Valuation Report for This Property
The Home Valuation Report is an in-depth analysis detailing your home's value as well as a comparison with similar homes in the area
Home Values in the Area
Average Home Value in this Area
Purchase History
| Date | Buyer | Sale Price | Title Company |
|---|---|---|---|
| Patel Biren | $440,000 | -- | |
| Butka Gina | $435,000 | -- | |
| Ascolese Eugene | $295,000 | -- |
Source: Public Records
Mortgage History
| Date | Status | Borrower | Loan Amount |
|---|---|---|---|
| Open | Patel Biren | $352,000 | |
| Previous Owner | Butka Gina | $348,000 | |
| Previous Owner | Ascolese Eugene | $280,250 |
Source: Public Records
Tax History Compared to Growth
Tax History
| Year | Tax Paid | Tax Assessment Tax Assessment Total Assessment is a certain percentage of the fair market value that is determined by local assessors to be the total taxable value of land and additions on the property. | Land | Improvement |
|---|---|---|---|---|
| 2025 | $11,101 | $312,800 | $167,300 | $145,500 |
| 2024 | $10,932 | $312,800 | $167,300 | $145,500 |
| 2023 | $10,801 | $312,800 | $167,300 | $145,500 |
| 2022 | $10,801 | $312,800 | $167,300 | $145,500 |
| 2021 | $10,810 | $312,800 | $167,300 | $145,500 |
| 2020 | $10,729 | $312,800 | $167,300 | $145,500 |
| 2019 | $10,541 | $312,800 | $167,300 | $145,500 |
| 2018 | $10,347 | $312,800 | $167,300 | $145,500 |
| 2017 | $10,091 | $312,800 | $167,300 | $145,500 |
| 2016 | $9,813 | $312,800 | $167,300 | $145,500 |
| 2015 | $9,628 | $312,800 | $167,300 | $145,500 |
| 2014 | $9,465 | $312,800 | $167,300 | $145,500 |
Source: Public Records
Map
Nearby Homes
- 0- 93 34th St
- 31-12 Rosalie St
- 0- 84 Elden Place
- 2-35 Virginia Dr Unit A
- 39-16 Northern Dr
- 39-18 Romana Dr
- 34-14 Linwood Rd Unit 1X
- 28-07 Zachary Terrace Unit 1X
- 3-03 Pickett Place
- 021 27th St
- 595 Pine Ave
- 24-09 Raphael St Unit 1X
- 79 Strathmore Terrace
- 126 Skillman Terrace
- 4-21 Saddle River Rd
- 599 Ash Ave
- 16 van Saun Place Unit 1X
- 26-14 Morlot Ave Unit 1X
- 595 Elm Ave
- 278 Starling Ct