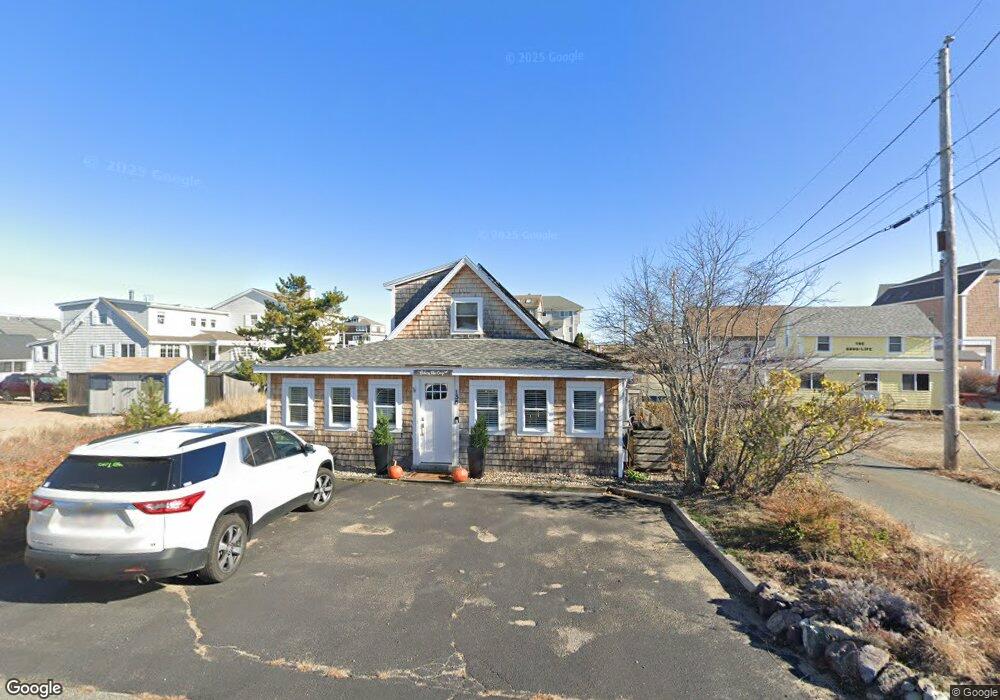
1 45th St Newbury, MA 01951
Estimated Value: $806,000 - $924,534
3
Beds
1
Bath
1,128
Sq Ft
$782/Sq Ft
Est. Value
About This Home
This home is located at 1 45th St, Newbury, MA 01951 and is currently estimated at $882,634, approximately $782 per square foot. 1 45th St is a home located in Essex County with nearby schools including Triton Regional High School and Immaculate Conception School.
Ownership History
Date
Name
Owned For
Owner Type
Purchase Details
Closed on
Apr 16, 2025
Sold by
Cooper Debra H and Cooper William S
Bought by
138 Northern Blvd Rt and Cooper
Current Estimated Value
Purchase Details
Closed on
May 26, 2020
Sold by
Cooper William S and Fresher Allison H
Bought by
Cooper Debra H and Cooper William S
Purchase Details
Closed on
Oct 29, 2003
Sold by
Rainha Alfred and Atwood Robert
Bought by
Cooper William S and Fresher Allison H
Purchase Details
Closed on
Apr 12, 2002
Sold by
Gill Ernest L
Bought by
Atwood Robert and Rainha Alfred
Create a Home Valuation Report for This Property
The Home Valuation Report is an in-depth analysis detailing your home's value as well as a comparison with similar homes in the area
Home Values in the Area
Average Home Value in this Area
Purchase History
| Date | Buyer | Sale Price | Title Company |
|---|---|---|---|
| 138 Northern Blvd Rt | -- | None Available | |
| 138 Northern Blvd Rt | -- | None Available | |
| Cooper Debra H | $35,000 | None Available | |
| Cooper Debra H | $35,000 | None Available | |
| Cooper Debra H | $35,000 | None Available | |
| Cooper Debra H | $35,000 | None Available | |
| Cooper William S | $393,250 | -- | |
| Atwood Robert | $289,000 | -- | |
| Cooper William S | $393,250 | -- | |
| Atwood Robert | $289,000 | -- |
Source: Public Records
Mortgage History
| Date | Status | Borrower | Loan Amount |
|---|---|---|---|
| Previous Owner | Atwood Robert | $255,550 | |
| Previous Owner | Atwood Robert | $10,000 | |
| Previous Owner | Atwood Robert | $30,000 |
Source: Public Records
Tax History Compared to Growth
Tax History
| Year | Tax Paid | Tax Assessment Tax Assessment Total Assessment is a certain percentage of the fair market value that is determined by local assessors to be the total taxable value of land and additions on the property. | Land | Improvement |
|---|---|---|---|---|
| 2025 | $6,578 | $883,000 | $641,200 | $241,800 |
| 2024 | $6,358 | $827,800 | $598,500 | $229,300 |
| 2023 | $5,175 | $596,900 | $390,100 | $206,800 |
| 2022 | $4,936 | $507,300 | $331,300 | $176,000 |
| 2021 | $4,550 | $426,800 | $277,900 | $148,900 |
| 2020 | $4,150 | $377,600 | $235,100 | $142,500 |
| 2019 | $4,082 | $377,600 | $235,100 | $142,500 |
| 2018 | $3,939 | $361,400 | $235,100 | $126,300 |
| 2017 | $3,777 | $356,000 | $235,100 | $120,900 |
| 2016 | $3,966 | $347,900 | $235,100 | $112,800 |
| 2015 | $3,761 | $326,500 | $213,700 | $112,800 |
| 2014 | $3,696 | $326,500 | $213,700 | $112,800 |
Source: Public Records
Map
Nearby Homes
- 4 54th St
- 12 53rd St
- 5 Helena St
- 11 Harbor St
- 12 Barker St
- 44 Old Point Rd
- 5 Northern Blvd
- 2 Plum Island Blvd
- 11 Sunset Dr
- 2 Sunset Dr
- 28 & 30 Plum Island Turnpike
- 10 Meadowview Ln Unit B
- 65 Plum Island Turnpike
- 141 Atlantic Ave
- 116 Railroad Ave
- 114 Railroad Ave
- 52 Brissette Ave
- 103 Railroad Ave
- 101 Cable Ave
- 33 Union St
- 140 Northern Blvd
- 4 45th St
- 137 Northern Blvd
- 137 Northern Blvd Unit 2
- 137 Northern Blvd Unit 1
- 137 Northern Blvd Unit 1B 1
- 4 47th St
- 5 45th St
- 135 Northern Blvd
- 134 Northern Blvd
- 3 43rd St
- 6 45th St
- 3 50th St
- 3 47th St
- 133 Northern Blvd
- 133 Northern Blvd Unit 2
- 7 45th St
- 5 43rd St
- 139 Northern Blvd
- 4 48th St