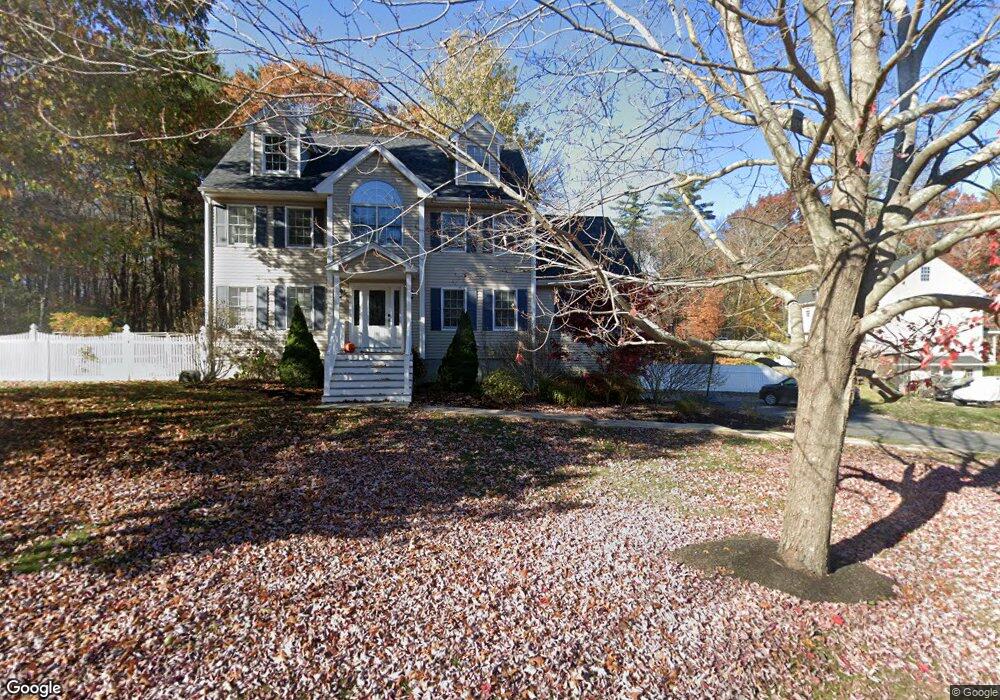
1 Ahern Cir Merrimac, MA 01860
Estimated Value: $868,000 - $947,000
3
Beds
3
Baths
2,403
Sq Ft
$377/Sq Ft
Est. Value
About This Home
This home is located at 1 Ahern Cir, Merrimac, MA 01860 and is currently estimated at $905,981, approximately $377 per square foot. 1 Ahern Cir is a home located in Essex County with nearby schools including Pentucket Regional High School.
Ownership History
Date
Name
Owned For
Owner Type
Purchase Details
Closed on
Jan 29, 2024
Sold by
Hilts Kenneth L and Hilts Lori A
Bought by
Kenneth & Lori Hilts Ret and Hilts
Current Estimated Value
Purchase Details
Closed on
Aug 15, 2000
Sold by
Rkacco Llc
Bought by
Hilts Kenneth L and Hilts Lori A
Create a Home Valuation Report for This Property
The Home Valuation Report is an in-depth analysis detailing your home's value as well as a comparison with similar homes in the area
Home Values in the Area
Average Home Value in this Area
Purchase History
| Date | Buyer | Sale Price | Title Company |
|---|---|---|---|
| Kenneth & Lori Hilts Ret | -- | None Available | |
| Hilts Kenneth L | $342,850 | -- |
Source: Public Records
Mortgage History
| Date | Status | Borrower | Loan Amount |
|---|---|---|---|
| Previous Owner | Hilts Kenneth L | $100,000 | |
| Previous Owner | Hilts Kenneth L | $267,000 | |
| Previous Owner | Hilts Kenneth L | $40,000 |
Source: Public Records
Tax History Compared to Growth
Tax History
| Year | Tax Paid | Tax Assessment Tax Assessment Total Assessment is a certain percentage of the fair market value that is determined by local assessors to be the total taxable value of land and additions on the property. | Land | Improvement |
|---|---|---|---|---|
| 2025 | $10,456 | $789,100 | $361,200 | $427,900 |
| 2024 | $10,022 | $742,400 | $318,700 | $423,700 |
| 2023 | $9,162 | $620,300 | $267,700 | $352,600 |
| 2022 | $8,891 | $544,100 | $233,700 | $310,400 |
| 2021 | $8,523 | $522,900 | $212,500 | $310,400 |
| 2020 | $7,781 | $522,900 | $212,500 | $310,400 |
| 2019 | $7,611 | $481,400 | $182,700 | $298,700 |
| 2018 | $7,291 | $462,600 | $170,000 | $292,600 |
| 2017 | $7,410 | $453,500 | $170,000 | $283,500 |
| 2016 | $6,820 | $422,000 | $144,500 | $277,500 |
| 2015 | $6,515 | $400,900 | $144,500 | $256,400 |
| 2014 | $6,380 | $401,500 | $144,500 | $257,000 |
Source: Public Records
Map
Nearby Homes