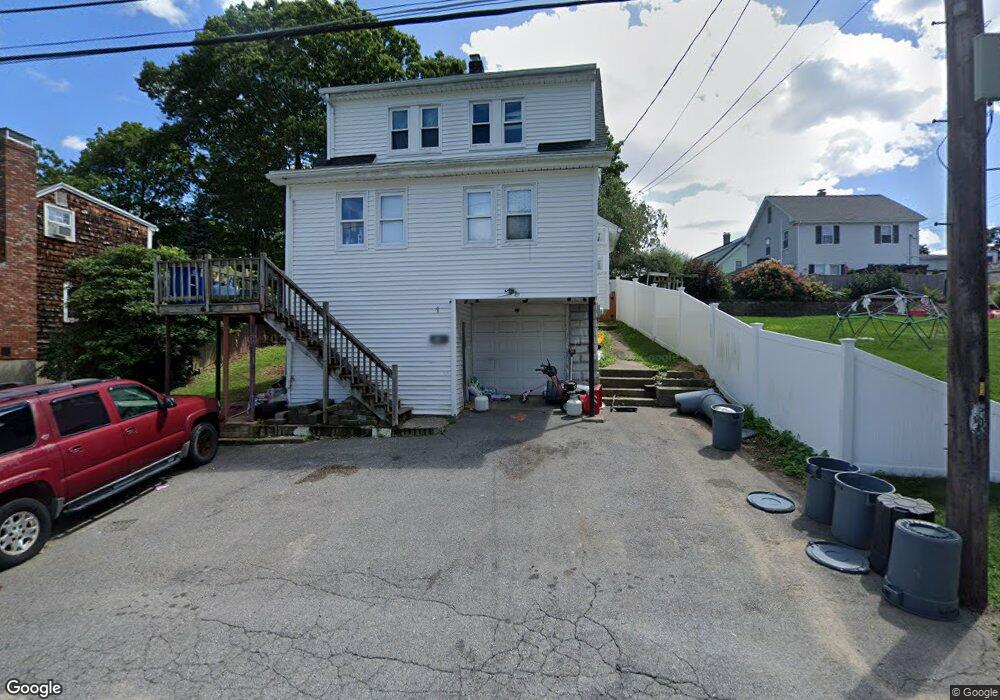
1 Albert St Woburn, MA 01801
Mishawum NeighborhoodEstimated Value: $591,042 - $716,000
3
Beds
1
Bath
1,208
Sq Ft
$521/Sq Ft
Est. Value
About This Home
This home is located at 1 Albert St, Woburn, MA 01801 and is currently estimated at $629,261, approximately $520 per square foot. 1 Albert St is a home located in Middlesex County with nearby schools including Malcolm White Elementary School, John F. Kennedy Middle School, and Woburn High School.
Ownership History
Date
Name
Owned For
Owner Type
Purchase Details
Closed on
Dec 1, 2017
Sold by
Anderson Margaret L
Bought by
Anderson Margaret L and Anderson Jason E
Current Estimated Value
Purchase Details
Closed on
Aug 15, 2017
Sold by
Macinnes Kevin J Est and Anderson
Bought by
Anderson Margaret L
Purchase Details
Closed on
Jan 1, 1977
Bought by
Macinnes Kevin J
Create a Home Valuation Report for This Property
The Home Valuation Report is an in-depth analysis detailing your home's value as well as a comparison with similar homes in the area
Home Values in the Area
Average Home Value in this Area
Purchase History
| Date | Buyer | Sale Price | Title Company |
|---|---|---|---|
| Anderson Margaret L | -- | -- | |
| Anderson Margaret L | -- | -- | |
| Anderson Margaret L | -- | -- | |
| Anderson Margaret L | -- | -- | |
| Macinnes Kevin J | -- | -- |
Source: Public Records
Mortgage History
| Date | Status | Borrower | Loan Amount |
|---|---|---|---|
| Previous Owner | Macinnes Kevin J | $172,000 | |
| Previous Owner | Macinnes Kevin J | $127,800 | |
| Previous Owner | Macinnes Kevin J | $103,000 |
Source: Public Records
Tax History
| Year | Tax Paid | Tax Assessment Tax Assessment Total Assessment is a certain percentage of the fair market value that is determined by local assessors to be the total taxable value of land and additions on the property. | Land | Improvement |
|---|---|---|---|---|
| 2025 | $4,357 | $510,200 | $275,900 | $234,300 |
| 2024 | $3,873 | $480,500 | $262,800 | $217,700 |
| 2023 | $3,885 | $446,600 | $238,900 | $207,700 |
| 2022 | $3,715 | $397,800 | $207,700 | $190,100 |
| 2021 | $3,412 | $365,700 | $197,800 | $167,900 |
| 2020 | $3,398 | $364,600 | $197,800 | $166,800 |
| 2019 | $6,268 | $347,900 | $188,400 | $159,500 |
| 2018 | $3,135 | $317,000 | $172,900 | $144,100 |
| 2017 | $5,418 | $299,000 | $164,700 | $134,300 |
| 2016 | $2,831 | $281,700 | $153,900 | $127,800 |
| 2015 | $2,717 | $267,200 | $143,800 | $123,400 |
| 2014 | $2,653 | $254,100 | $143,800 | $110,300 |
Source: Public Records
Map
Nearby Homes
- 18 Cranston Cir
- 0 Fryeburg Rd
- 16 Felton St
- 14 Church Ave
- 555 Main St Unit 11
- 8 Callahan Dr
- 6 Callahan Dr
- 166 Place Ln Unit 166
- 168 Place Ln
- 380 Place Ln
- 21 Eastern Ave
- 477 Main St
- 39 Jefferson Ave
- 31 Montvale Ave Unit 2
- 35 Montvale Ave Unit 8
- 45 Lowell St
- 18 Central St
- 7 Prospect St
- 31 Tremont St
- 17 Wright St
Your Personal Tour Guide
Ask me questions while you tour the home.